By Halvor Kvande, NTNU (Retired); Gudrun Saevarsdottir, Reykjavik University;
and Barry Welch, Welbank Consulting.
Abstract
While global average greenhouse gas (GHG) emissions have changed little over the last several years, the best available data has become more reliable and has showed lower emissions. The electrolysis process has now been performed with a low emission rate of 1.40 t CO2e/t Al, while alumina production presently requires at least 1.0 t CO2e/t Al and production of prebaked carbon anodes emits about 0.8 t CO2e/t Al. Combined, this best available data amounts to 3.2 t CO2e/t Al. In total, this is well below the value of 4.0 CO2e/t Al that is presently considered as a measure for so-called low-carbon aluminum production. With carbon capture and sequestration (CCS), the emissions can, in theory, be reduced to about 1.0 t CO2e/t Al, while inert anodes can bring the total emissions down to about 0.2 t CO2e/t. Inert anodes therefore represent the greatest carbon-reducing solution. The only process emissions would then come from alumina refining, and eventually from production and recycling of the electrodes.
Introduction
There is a great international push to curb climate change and promote sustainable development, and one of the terms most often used now is “decarbonization.” The word literally means reduction of carbon use, or removing carbon from the system. Thus, decarbonization is the process of reducing the carbon dioxide emissions from industrial processes through various strategies. For the global aluminum industry, this word has been used extensively in recent years, because decarbonization will be imperative for the sustainability and the foreseeable future of the aluminum production.
A number of countries and organizations have introduced laws or announced proposals to achieve net zero emissions by 2050. For the aluminum industry, the International Aluminium Institute (IAI) has identified three broad technological approach categories (termed “pathways”) for achieving the emissions reduction required by 2050, while also meeting growing demand for aluminum.1-2 These three pathways include: electricity decarbonization by using clean energy (solar, wind, water, nuclear) instead of fossil fuels (coal, gas, oil), direct emissions reduction from the various industrial production process steps, and recycling and resource efficiency.
The purpose of this article is to discuss the best available data for the carbon dioxide equivalent (CO2e) emission data for aluminum production and present concepts for how the emissions can be further reduced. It will also highlight the opportunities and challenges for the aluminum industry in working toward the 2050 goal of zero emissions.
GHG Protocol Scopes for Emissions
The Intergovernmental Panel on Climate Change (IPCC) along with other organizations has introduced the Greenhouse Gas Protocol, which outlines three main scopes for defining emissions from an industry.3 In this analysis of the GHG emissions for the aluminum value chain, from bauxite mine to primary aluminum ingot, these three scopes will be used to define the operational boundaries in relation to direct and indirect emissions.
Scope 1 – Direct Emissions: These include all direct GHG emissions occurring at the site of the aluminum smelter, which are dominated by the CO2 and perfluorocarbon (PFC) emissions from the electrolysis cells in the potrooms. Many smelters produce their own prebaked carbon anodes, while others purchase the anodes from suppliers. It is not known what percentage of the world’s smelters have their own carbon plant, but this determines whether these emissions would belong to Scope 1 or 3.
Globally, 45% of the electric power used in primary aluminum production is now purchased from suppliers, and 55% is self-generated.4 When the electric power is self-generated from fossil sources, it is included in the direct site emissions (Scope 1), as would the equivalent emissions arising from fuel combustion of transport vehicles. In addition to the electricity used for aluminum production, there are also significant CO2 equivalent emissions from fossil fuel energy used for the necessary ancillary services at the smelter. These include AC power for operating facilities and buildings like the casthouse, compressor house, gas treatment center, central workshop, rectifier auxiliary power, etc.
Scope 2 – Indirect Electricity-Related Emissions: These are categorized by indirect CO2 equivalent emissions from the purchased electrical energy that is consumed in the smelter.
Scope 3 – Other Indirect Upstream Emissions: These are associated with extraction and production of materials sourced from entities separate from the smelter. Examples are those attributed to bauxite ore mining and transport, extracting and delivering the alumina to the electrolysis cells, and the linked emissions for the limestone and caustic soda used in alumina production. Emissions associated with production of anode raw materials (green and calcined petroleum coke and coal tar pitch) through to the finished prebaked carbon anodes and bath materials (aluminum fluoride and cryolite). The carbon-containing materials linked to production of cathode materials (like cathode blocks, ramming paste, and silicon carbide sidewall blocks) are also included here.
Sources of Emissions in Aluminum Production
Electric Power
In 2021, 67% of the power used to produce aluminum originated from fossil fuel sources, mainly coal (57%), but also natural gas (10%).4 This means that two-thirds of the total emissions (about 10 t CO2e/t Al) from aluminum production arise from the electricity generation for the electrolysis step. Thus, switching to decarbonized power generation is the biggest step that the global aluminum industry can take for emissions reduction and is therefore the number one technological pathway. However, this article will concentrate on the production made by smelters with renewable and emission-free power.
Alumina Production
CO2 is not produced directly in the Bayer process and most of the emissions from alumina production come from fossil fuel combustion, supplying thermal energy to the process. Previous estimation of these emissions has been 1.5 ± 0.4 t CO2e/t Al, depending on the energy source used.5-7 According to IAI data from 2018, the global average emissions for alumina production is considerably higher (2.7 t CO2e/t Al) and the largest contribution is from thermal energy, emitting 1.9 t CO2e/t Al.4 The lowest value is probably 0.516 t CO2e/t Al2O3 from Aughinish Alumina in Ireland, which corresponds to 0.97 t CO2e/t Al.8 Recent data from Edwards, et al., notes that emissions from the alumina supplier refinery of Aluminerie Alouette is in the range of 0.60–0.62 t CO2/t Al2O3, including bauxite mining.9 This corresponds to 1.13–1.17 t CO2e/t Al.
To decarbonize the emissions from alumina refineries new low-carbon digestion and calcination technology will be required. This includes technologies like fuel switching by converting boilers and calciners to use liquid natural gas (LNG), mechanical vapor recompression (MVR), and by heat recovery. Electric boilers are now proven technology for steam generation.
Prebaked Carbon Anode Production
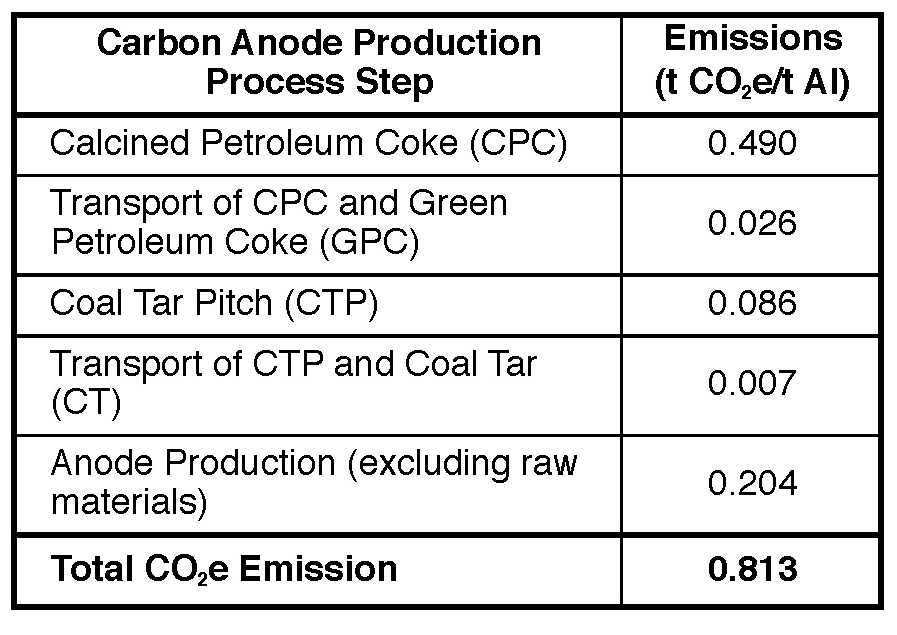
It has been estimated that the production of prebaked anodes and their raw materials typically emits 0.5–0.6 t CO2e/t Al,5-7 and IAI has reported a global average value of 0.5 t CO2e/t Al.4 Edwards, et al., have given a new and more thorough analysis of the entire prebaked anode production process, with a reported value of 0.813 t CO2e/t Al.9 The detailed emissions from each of the various process steps are shown in Table I.
Edwards, et al., estimated that the global average emissions are 1.026 t CO2e/t Al,9 while the Canadian reference smelters use anodes with a carbon footprint of 0.931 t CO2e/t Al. Thus, the emission data for carbon anode production used in previous reports may be an underestimate of the emissions,4-7 and thus, 1.0 t CO2e/t Al for the global average is probably a more correct value. Further improvement is possible by a switch from fuel oil to natural gas in the anode baking furnaces.
Aluminum Production
The electrolysis process is a large contributor among the aluminum production processes and will remain so as long as carbon anodes are used.6 There are two major ways of reducing these emissions, lowering net anode carbon consumption and lowering the frequency and duration of the anode effect, which causes PFC emissions. Net anode consumption data for most modern smelters is between 390 and 420 kg C/t Al, which means that the CO2 emissions are between 1.4 and 1.6 t CO2e/t Al. The strong focus of the aluminum smelters on reducing the process-related PFC emissions has now brought the global average value for point-fed prebake cells (non-China) down to 0.19 t CO2e/t Al.10 Cells with the best available technology can achieve PFC emissions as low as 0.02 t CO2e/t Al.6
The lowest total emission value from aluminum electrolysis cells reported so far is 1.40 t CO2e/t Al,11 accounting for both the net anode carbon consumption and the PFC formation during anode effects. The emissions from cells with carbon anodes are unlikely ever to be lower than about 1.33 t CO2e/t Al.7 This corresponds to net anode carbon consumption close to 370 kg C/t Al.
Measuring Low-Carbon Aluminum
Aluminerie Alouette and Hydro have given detailed emissions data for their various process steps, from cradle-to-gate aluminum production (Table II). It is hoped that more smelters will publish data like this to allow a realistic assessment of the decarbonization challenge.
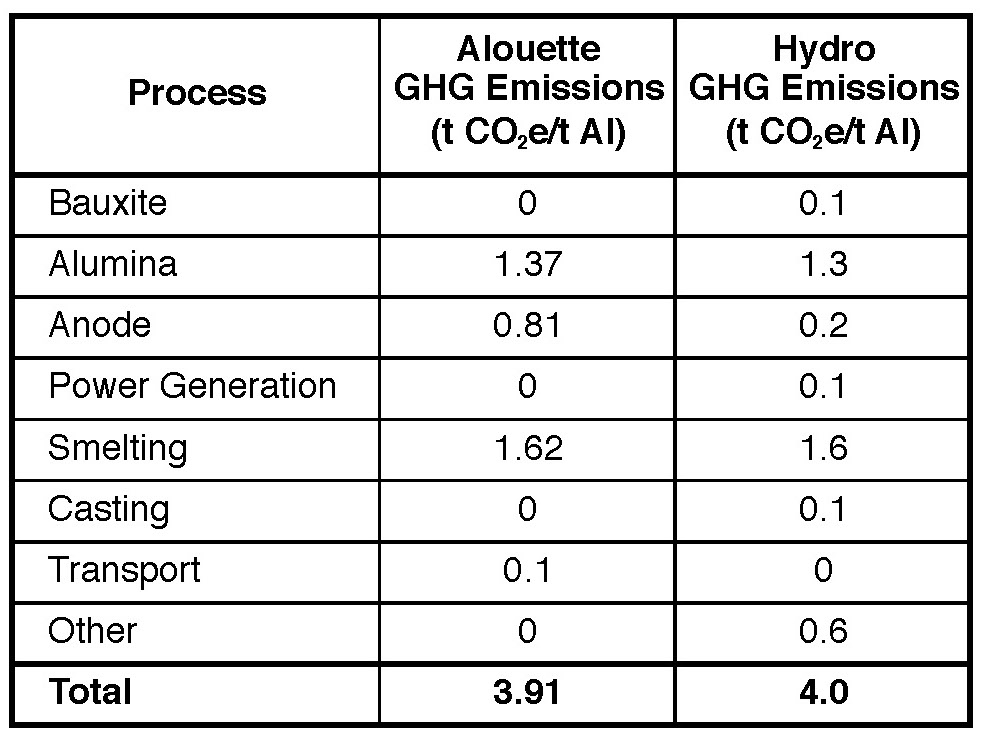
The three largest contributions here are from the smelting and the production of the raw materials alumina and carbon anodes. The agreement between the data is good, except for the anodes. It is likely that the Hydro value of 0.2 t CO2e/t Al is from the anode baking only and that it does not include the production of the raw materials for the anodes, calcined petroleum coke (CPC), and coal tar pitch (CTP). The production of CPC and CTP emits 0.6 t CO2e/t Al,9 as seen from the data in Table I, and this is perhaps included under the “Other” category in Hydro´s estimate.
Major aluminum producers have launched hydropower-based primary aluminum with a maximum carbon footprint of 4.0 t CO2e/t Al.11-16 This value is now considered a global benchmark for emissions. However, in many cases, the exact data for each of the main process steps is not published, and it is not always clear what is included in the calculations. There is a lack of consistency on the threshold carbon intensity level and even the scope of the emissions being measured and communicated. Some companies refer only to Scope 1 and 2 when marketing low-carbon aluminum with less than 4.0 t CO2e/t Al produced. The Carbon Trust has presented recommendations for a clear methodology for calculating the carbon footprint of primary aluminum, accounting for the specific source of electricity, as a basis for establishing qualification criteria to carry a lower carbon aluminum “label” as a demonstration of present performance.13
ASI Requirements
In 2017, the Aluminium Stewardship Initiative (ASI) set requirements for GHG emissions from aluminum smelters with its ASI Performance Standard.17 One requirement at the time was that the direct and indirect emissions from all present and future smelters should be at a level below 8 t CO2e/t Al by 2030 or earlier. However, at that point, the ASI was considering only the direct emissions from the smelter, plus the indirect emissions from the electric power production (Scope 1 and 2).
Kvande, et al., raised the question regarding the potential need for a revision of the ASI Performance Standard, changing it to use the total emissions number instead (which would include Scope 3 emissions).18 This would thus enable the standard to refer to all of the cradle-to-gate aluminum ingot production processes combined. In the recently published revised version of the ASI Performance Standard, this change was introduced.19 It now states, “Where an entity is engaged in aluminum smelting … the entity shall demonstrate that the average mine to metal emissions intensity is below 11.0 tonnes CO2e per metric tonne of cast aluminum.”
The change to also include the Scope 3 emissions in the ASI Performance Standard is very good, because it then includes all of the production process steps in the entire value chain. In comparison with the global average emissions of 16 t CO2e/t Al, this is a step in the right direction. However, the requirement of 11.0 t CO2e/t Al is still very high (representing 11 times more CO2 than aluminum) compared to entities with the best available technology and renewable electricity, particularly because the expectation is to move towards carbon neutrality in the future.
Additional Areas for Emissions Reduction
Recycling
Aluminum recycling is the process by which scrap aluminum can be reused in products after its initial (primary) production. The source of scrap, whether it is pre-consumer or post-consumer scrap, is very important for the emissions. Pre-consumer scrap has not been used and therefore retains the carbon footprint of the primary production process. Meanwhile, the treatment of post-consumer scrap involves remelting and treating used metal, which means that the emissions from electrolysis and upstream production of alumina and carbon anodes are not included. This pathway results in an average carbon footprint of approximately 1.1 t CO2e/t Al.14 According to data from IAI, the process emissions from post-consumer scrap is 0.6 t CO2e/t Al,4 while Hydro reports that post-consumer scrap has a carbon footprint of about 0.5 t CO2e/t Al.20 This results from post-consumer scrap collection, transport, sorting, and remelting. Recently, Hartlieb reported the low value of 0.21 t CO2e/t Al for recycled aluminum used in wheels.21
Carbon Capture and Sequestration
In cells with carbon anodes the carbon dioxide formation cannot be prevented. However, a potential method of emission reduction is possible through the capturing of the gas at the production source and subsequent sequestration, a process known as CCS. Because of the low CO2 concentration in the smelters’ flue gases (approximately 1%), it has been assumed that cell redesign will be required to increase the CO2 concentration.22 However, Voskian and Hatton reported a method for carbon up-concentration based on electrochemical methods,23 which indicates that it may be possible to capture CO2 from streams with concentrations as low as 0.6% and with energy use of around 0.85 kWh/kg Al. This may reduce the necessity of changing the cell design.
According to Lassagne, et al., CCS technology is expected to be capable of reducing CO2 emissions in smelter flue gases by 90%, but not reducing PFC emissions.24 This means that with CCS about 0.15 t CO2e/t Al will still remain from the carbon anodes, plus about 0.1 t CO2e/t Al from the PFC emissions, resulting in a total cell emission of about 0.25 t CO2e/t Al. So, even with CCS, the electrolysis process is not really carbon emission-free.
Inert Anodes and Cathodes
In electrolysis cells with inert anodes and cathodes, the aluminum is produced with nearly zero process emissions. Irrespective of whether it consists of a metal alloy or an oxide material, the electroactive surface of an inert anode must be an oxide with semiconducting properties. Because all oxide materials have a finite solubility in the highly corrosive fluoride electrolyte, a completely inert anode is unlikely to be found. The emissions from inert anode cells have been reported to be less than 0.01 t CO2e/t Al for Scope 1 and 2 direct and indirect energy related emissions.8 It is noted that no perfluorocarbon gases (CF4 and C2F6) are formed with inert anodes, because there is no carbon in the system.
Then, only Scope 3 emissions will remain, which are related to indirect emissions from the production of the raw materials and also the making of the inert anodes and cathodes. This data is not published, but the emissions are expected to be small, probably of the same order of magnitude as for the electrolysis process (0.01 t CO2e/t Al). Recycling of the anodes and cathodes at the end of their service life will contribute to keeping the electrode carbon footprint low. However, it should be remembered that even for inert anode cells, the production of alumina should also be included as part of the Scope 3 emissions.
The Cost of Decarbonization
The elephant in the room is of course what all these actions will cost. The Mission Possible Partnership (MPP) has estimated that a cumulative investment of approximately US$1 trillion will be needed across the primary aluminum production value chain to obtain net-zero emissions by 2050.16 The approximate investment estimations in the four main categories were:
- Low-carbon electric power: US$500 billion
- Inert anodes retrofits in smelters: US$200 billion (highly uncertain, however)
- Alumina refineries: US$36 billion
- CO2 transport and storage infrastructure: US$26 billion
These numbers are not easy to comprehend, so it is better to look at the specific costs. Low-carbon aluminum could increase production costs by up to US$400/t Al on average by 2035.16 Presently, a US$400/t Al increase in the cost of production would represent ~20% of the LME price at a time when a lot of smelters are struggling to break even. However, cost increases will vary significantly from producer to producer, depending on their current circumstances. Smelters could see significant variation, with cost increases of between US$75/t Al and US$600/t Al, depending on their power arrangements.16
Final Remarks
Several aluminum producers have announced the target to reduce their emissions by about 30% by 2030. This probably refers to their total emissions and not only their best specific data. For the global average emissions (with renewable power), this would mean a reduction from 5.6 to 3.9 t CO2e/t Al. With the low present emissions of 4.0 t CO2e/t Al, this would mean that 2.8 t CO2e/t Al is the target. This is possible, but will require a significant reduction in the emissions from alumina refining and carbon anode production. The main production process (electrolysis) has less possibilities for enabling significant emission reductions from the best present level of 1.40 t CO2e/t Al.
Looking further ahead toward 2050, the data for global average emissions and for the best available technologies (BAT) are summarized in Table III, assuming that the electric power comes from renewable sources with zero CO2 emissions.
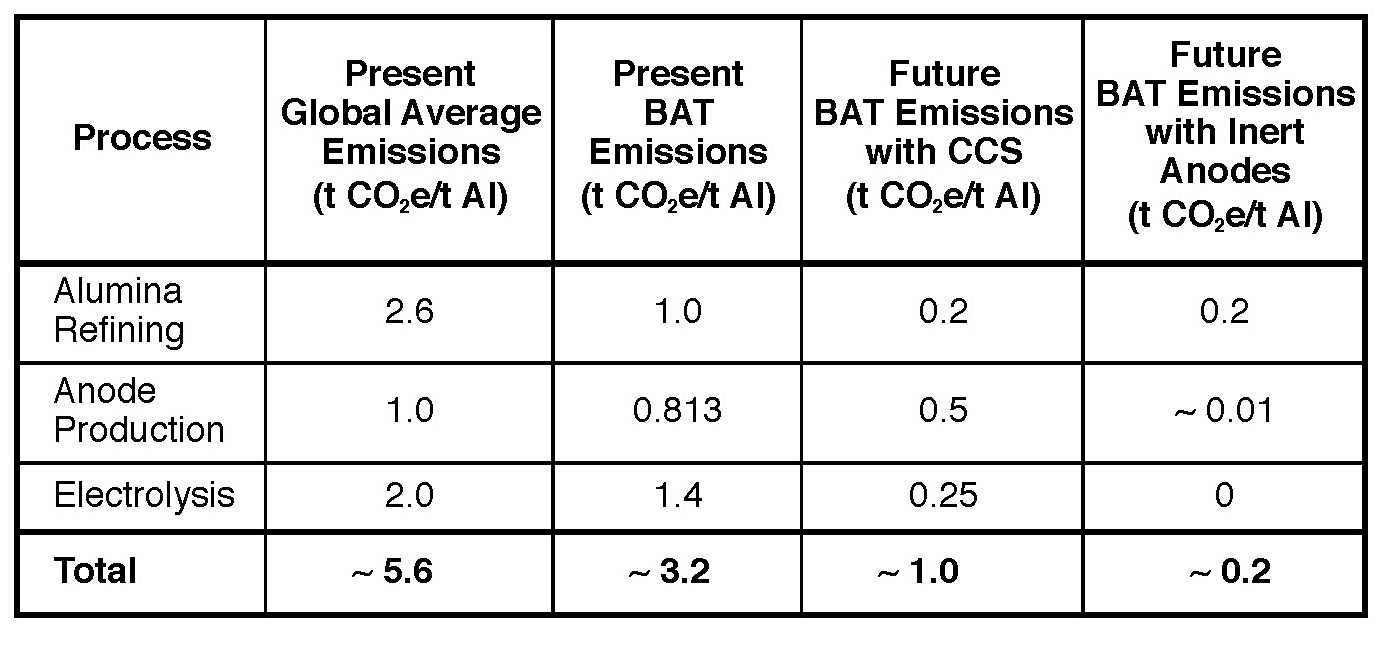
It is reasonable to assume that the emissions from the alumina refining process will be reduced. For the future BAT values shown in Table III, the estimated global average emissions of 0.2 t CO2e/t Al were used for refineries in 2050.16 For carbon anode production, the recent study of the emissions at Alouette, written by Edwards, et al., reported 1.026 t CO2e/t Al as their global average value.9 This indicates that the present global average value of 0.5 t CO2e/t Al may be too low. However, it is reasonable to assume that this value will also be improved. As a result, 0.5 t CO2e/t Al was tentatively selected as the future BAT value for carbon anode production.
The total global average emission value (with renewable power) of ~5.6 t CO2e/t Al is uncertain, but in any case this value is surely higher than the threshold value of 4.0 t CO2e/t Al for so-called low carbon aluminum. For the BAT data, the two main raw materials alumina and carbon anodes together presently contribute at least 1.8 t CO2e/t Al, and if the very best data for electrolysis is included (1.40 t CO2e/t Al),11 then the best available data when combined would amount to ~3.2 t CO2e/t Al. With CCS, the electrolysis emissions are reduced considerably, and the total emissions are close to 1.0 t CO2e/t Al. Inert anodes will bring the emissions down to about 0.2 t CO2e/t Al. Therefore, there is no doubt that inert anodes represent the greatest carbon reduction and probably also the most cost effective solution. In that case, the only significant emissions then come from the alumina refining.
While it appears that there is a clear path to decarbonization for the aluminum industry, reaching the goal of net-zero emissions by 2050 will require significant changes to the upstream alumina and anode supply chains, the aluminum electrolysis step, and also downstream recycling. Until the alumina and the anodes can arrive to the smelter as GHG emissions free and until electrolysis does not emit any significant amount of CO2, no one can claim to be producing and selling truly emissions-free (green) aluminum. There are real technical challenges that need to be overcome to make the aluminum fully decarbonized, and it will be very expensive. However, the aluminum industry — along with all other sectors of society — will need to do it.
References
- “Aluminium Sector Greenhouse Gas Pathways to 2050,” IAI, 2021.
- “The Sustainable Road Ahead: International Aluminum Organizations Present Environment Goals,” Light Metal Age, April 12, 2021.
- “The Greenhouse Gas Protocol: A Corporate Accounting and Reporting Standard (Revised Edition),” World Business Council for Sustainable Development and World Resources Institute, 2014.
- “Greenhouse Gas Emissions – Primary Aluminium,” IAI, Date of Issue: October 5, 2021.
- Saevarsdottir, G., H. Kvande, and B.J. Welch, “Aluminum Production in the Times of Climate Change: The Global Challenge to Reduce the Carbon Footprint and Prevent Carbon Leakage,” Journal of Metals (JOM), Vol. 72, 2020, pp. 296-308, https://doi.org/10.1007/s11837-019-03918-6.
- Kvande, H., and B.J. Welch, “How to Minimize the Carbon Footprint from Aluminum Smelters,” Light Metal Age, Vol. 76, No. 1, 2018, pp. 28-41.
- Saevarsdottir, G., H. Kvande, and B.J. Welch, “Reducing the Carbon Footprint: Aluminium Smelting with Changing Energy Systems and the Risk of Carbon Leakage,” Light Metals 2020, Tomsett, A (ed), TMS, Pittsburgh, Springer, NY, pp. 726-734.
- “Pathway to net zero 2021,” En+ Group, September 20, 2021, p. 13 & 35.
- Edwards, L., et al., “Quantifying the Carbon Footprint of the Alouette Primary Aluminum Smelter,” Journal of Metals (JOM), Vol. 74, 2022, https://doi.org/10.1007/s11837-022-05501-y.
- “Perfluorocarbon (PFC) Emissions,” IAI, 2020.
- Reny, P., et al., “Hydro’s New Karmøy Technology Pilot: Start-Up and Early Operation,” Light Metals 2021, L. Perander (ed), TMS, Pittsburgh, Springer, NY, pp. 608-617.
- Vatne, H.E., “Hydro’s Decarbonization Roadmap,” Presentation at Greener Aluminium Online Summit in association with Aluminium International Today, May 24, 2022.
- “The Case for Low Carbon Aluminium Labelling,” The Carbon Trust, 2020.
- Das, S., “The Quest for Low Carbon Aluminum: Developing a Sustainability Index,” Light Metal Age, Vol. 79, No. 1, 2021, pp. 34-43.
- Grandfield, J., “Update on the Aluminum Industry Response to Climate Change,” Light Metal Age, Vol. 78, No. 1, 2020, pp. 44-49.
- Ford, M., et al., “Making Net-Zero Aluminium Possible – An Industry-Backed 1.5°C-Aligned Transition Strategy,” Mission Possible Partnership (MPP) and Aluminium Transition Strategy, September 2022.
- “ASI Performance Standard V2 – Guidance,” Aluminium Stewardship Initiative, December 2017, p. 37.
- Kvande, H., G. Saevarsdottir, and B.J. Welch, “Direct and Indirect CO2 Equivalent Emissions from Primary Aluminium Production,” Light Metals 2022, D. Eskin (ed), TMS, Springer, Cham, pp. 998-1,003, https://doi.org/10.1007/978-3-030-92529-1_130.
- ASI Performance Standard (2022), Version 3, May 2022, p. 17.
- “Carbon Footprint of Recycled Aluminium,” Climate Action, May 20, 2021.
- Hartlieb, M., “Ronal Group Introduces Carbon Neutral Recycled Aluminum Wheel,” Light Metal Age, Vol. 80, No. 5, 2022, pp. 22-26.
- Mathisen, A., et al., “Cost Optimised CO2 Capture from Aluminium Production,” Energy Procedia, Vol. 51, 2014, pp. 184-190, https://doi.org/10.1016/j.egypro.2014.07.021.
- Voskian, S., and T.A. Hatton, “Faradaic electro-swing reactive adsorption for CO2 capture,” Energy & Environmental Science, Vol. 12, No. 12, 2019, pp. 3,530-3,547, DOI: 10.1039/C9EE02412C.
- Lassagne, O., et al., “Techno-economic Study of CO2 Capture for Aluminium Primary Production for Different Electrolytic Cell Ventilation Rates,” Chemical Engineering Journal, Vol. 230, 2013, pp. 338-350.
Editor’s Note: This article first appeared in the February 2023 issue of Light Metal Age. To receive the current issue, please subscribe.