By Jinlong “Marshall” Wang, Aluminum Association; Jessica Sanderson, Novelis North America; Chris Moore, Consultant for Arconic; Duncan Pitchford, Hydro North America; Jerome Fourmann, Rio Tinto North America; Karah Davenport, Stratacomm; and Kenneth Martchek, Martchek Consulting
The steel industry has made sensational life cycle assessment (LCA) claims about its products in automotive lightweighting applications over comparable aluminum solutions. The claims are largely based on highly biased research work. The process of making those claims is fundamentally flawed and in direct violation of multiple international standards and guidelines related to the study and communication of LCA.
Through detailed analysis, this paper shows that the biased research work done by the steel industry concentrates on manipulating key factors in its LCA model to create a false advantage for relevant steel products. The manipulation is done in the following aspects:
- Suppressed mass reduction potential of aluminum with exaggerated mass reduction potential of advanced high-strength steel (AHSS), leading to inaccurate depiction of product masses.
- Selected exceptionally low mass-induced fuel saving parameters to favor heavier AHSS-intensive vehicles over lighter aluminum-intensive vehicles.
- Created energy and greenhouse gas (GHG) values for primary aluminum for North American market instead of adopting accurate data published by the Aluminum Association.
- Assigned a higher recovery rate for steel recycling and a lower recovery rate for aluminum recycling, as well as turning 180° on its traditional position regarding end-of-life (EOL) allocation methods.
The cumulative effect of such manipulation is quantitatively significant. If these key factors were to be replaced with more accurate and commonly agreed upon ones, the conclusions would have been reversed and in agreement with the conclusions of most other similar studies including those conducted by the aluminum industry.
In addition to analyzing the methodological manipulation, this paper also raises concerns about the violations by the steel industry of basic ISO principles and rules related to making comparative assertions intended for public use. This is mainly reflected in two aspects:
- Comparing the carbon footprint of per kilogram primary raw material production to show one material is “superior” than the other, without stating the fundamental differences of the materials in property, intended application and function, functional unit, and other relevant aspects.
- Making claims based on extremely limited information in which no detailed reporting can be found and no trace of a required critical review process can be seen.
Introduction
LCA is a quantitative environmental assessment method designed to evaluate the cumulative environmental impact of a product throughout its life cycle—from cradle (e.g. the extraction of raw materials) through the use of the product over its lifetime to grave (e.g. the product is disposed or recycled).
The aluminum industry is a leader in LCA application. The first industry wide LCA study was done in 1993 by the Aluminum Association. In fact, the Association’s Product Stewardship program is built upon a life-cycle approach to reduce aluminum’s environmental footprint and enhance the material’s sustainability. A significant amount of work has been done by the Association to conduct transparent, accurate, and quality LCA studies on various aluminum product forms ranging from generic primary and secondary metals, semi-fabricated profiles, to final consumer products including aluminum automotive systems. All works of the Association have been critically reviewed and published through various platforms, including the Association websites (www.aluminum.org and www.drivealuminum.org), and all of them are easily accessed for public evaluation.
Efforts have also been made to incorporate data generated from those studies into popular databases and software tools, such as the U.S. LCI Database, GaBi, SimaPro, GREET, WARM, Athena Impact Estimator, etc., so that accurate and up-to-date North American aluminum data can be conveniently sourced by LCA practitioners and researchers. The Association also developed some of the data into Environmental Product Declarations to support multiple stakeholders. The aluminum industry takes LCA seriously and makes its best effort to be a highly responsible party.
In contrast, the steel industry, represented by World Auto Steel (WAS) and the American Iron & Steel Institute (AISI), often make misleading and erroneous claims on the life cycle GHG emissions of vehicle lightweighting.1-3 A close and objective assessment of those claims reveals that the steel industry is misleading both policymakers and the public by using biased studies and distorted facts for its own benefit. It serves as an obstructive force to slow down a remarkable automotive technology revolution to save its eroding market share.
This paper will scrutinize the steel industry’s studies and its selection of biased data that ignores critical parameters commonly agreed upon and widely recommended by the scientific community for automotive lightweighting LCA studies, including rules established by the International Organization for Standardization (ISO 14040/44 and ISO 14012/25) regarding how life cycle assessment should be conducted and results be communicated.4-7
LCA for Automotive Lightweighting
The application of LCA for assessment of automobiles is broad and extensive, covering many aspects such as driving technology options, material selection and lightweighting effects, fuel choices, ownership types (single-owner vs shared vehicles), etc. Each is a complex topic and deserves careful selection of appropriate data, methodology, assumption, and parameters to meet the intended objective of the LCA.
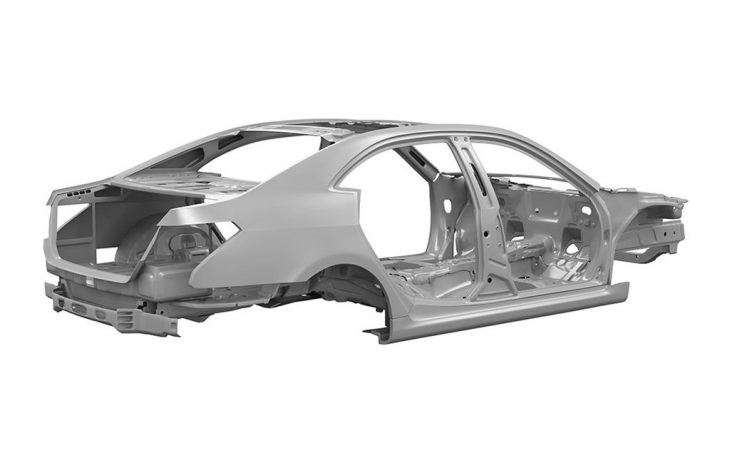
The focus of an LCA that examines the consequences of material selection and lightweighting includes not only the reduction of mass for individual parts, but also system implications. While individual part assessment studies do exist, the majority of published studies focus on examining lightweighting a system, a subsystem, or the full vehicle with design optimization. The most frequently examined system is the body and closure system since it has a large share of total mass and has high potential to be optimized to make a lighter, safer, and better-performing vehicle.
Many published papers and studies on the topic deal with comparing material design options such as aluminum, steel, carbon fiber, other polymer composites, or more often—a combination of them all (e.g. multi-material solutions) with one specific material in intensive application.
In 2017, Troy Hottle and his research team at the U.S. Environmental Protection Agency (EPA) reviewed 26 studies published during the period of 2010 to 2016, including case studies released by WAS and Steel Market Development Institute (SMDI).8 Of all the works reviewed by Hottle, et al., it was noted that “most of the LCAs demonstrated that aluminum-intensive designs were able to achieve the largest reductions in life cycle energy use and GHG impacts,” except for “the study by the Steel Market Development Institute…and case studies by World Auto Steel.”
The WAS and SMDI works are outliers because they are tailor-made for the steel industry, by the steel industry. The rest of the reviewed works, which determined aluminum-intensive designs achieved the largest reductions, were largely done by independent third-party researchers without much influence from the relevant material industries.
Guideline on LCA for Automotive
To minimize potential for complexity and abuse of flexibility, the Canadian Standards Association (CSA Group) organized stakeholders to develop a guidelines for automotive lightweighting LCA. The guideline sets forth principles and rules that are necessary to evaluate alternative designs and materials on a comparable basis at every stage of a LCA study, including defining and describing the product, general and specific requirements for the study, calculating environmental indicator results, communicating results, reporting, and critical review. These requirements were developed with participation and agreement from stakeholders, including academic institutions, material industry associations, LCA consulting firms, and others. All major automotive material industry associations participated, with WAS and SMDI representing the steel industry and the Aluminum Association representing the aluminum industry. The guideline, titled Life Cycle Assessment of Auto Parts – Guidelines for Conducting LCA of Auto Parts Incorporating Weight Changes Due to Material Composition, Manufacturing Technology, or Part Geometry, was published in 2014 with a standard code number SPE-14040-14.9
The SPE-14040-14 guideline provides specific recommendations for key factors that could have significant impact on the results of a study. These include mass-induced fuel reduction values (FRV), lifetime driving distances (LTDD), EOL material recycling allocation rules, and life cycle inventory (LCI) or LCA data source for materials. Another key factor, the material substitution rate (MSR), is not covered by the SPE-14040-14 guideline, since it assumes information for products (defined as “auto parts”), such as material composition, dimension, and weight, is already known to researchers.
Manipulated Technical Details by the Steel Work
The steel industry’s claims and its supporting evidence are based on a background LCA model originally developed by Dr. Roland Geyer at the University of California Santa Barbara. The model, named UCSB Automotive Energy and Greenhouse Gas Model (hereafter referred to as UCSB Model), was specifically developed for WAS.10 Steel industry trade associations both in Europe and North America generated many works out of the model, as follows:
- WAS released a host of case studies between 2013 and 2017, including a compact car, a sports utility vehicle (SUV), a light duty truck (LDT), and a battery electric vehicle (BEV) case.1 All were focused on making comparative claims of steel over aluminum, yet none of them can be accessed with a full report documenting details at the time of their publication.
- SMDI published an article in 2016 titled “The Importance of the Production Phase in Vehicle Life Cycle GHG Emissions.”3 The scenarios in the article are the equivalent of the WAS cases. Both are based on the UCSB Model with the same background data. The only difference is SMDI modified two parameters to reflect the North American situation, including LTDD and primary aluminum data. The paper is not in the format and level of detail of an LCA report, and there was no evidence to show that the paper has gone through a critical review process.
- The Steel Recycling Institute (SRI) published a study in 2018, titled “Lightweighting with Advanced High-Strength Steel Produces Lower Greenhouse Gas Emissions than Lightweighting with Aluminum.”11 This paper is a refined version of the SMDI paper. It is based on the latest version of UCSB Model (v5), incorporating LTDD and primary aluminum data for the North American market. It is worth noting that this is the only steel industry LCA study accompanied with a relatively detailed report that has also gone through a rigorous critical review process.
The UCSB Model has been updated several times and it is currently in version 5.0. The updates were mainly made to incorporate new data and to add new scenarios. However, key factors that have the most impact on the results are largely unchanged. These key factors, with arbitrarily selected values, have been used to help steel win over aluminum in mathematical calculations. Such factors include material substitution rate (MSR), mass-induced fuel reduction value (FRV), LTDD, EOL allocation method, and material recovery rates for recycling. In addition, inconsistent—and sometimes false—selection of primary aluminum LCI or life cycle inventory assessment (LCIA) data has added more bias toward the results.
Material Substitution and MSR
The steel industry’s UCSB Model is highly engineered with material substitution factors designed to favor AHSS over aluminum. First, the material substitution rate of aluminum is suppressed and the rate of AHSS is inflated. Secondly, there is no information showing which part, component, or system has gone through lightweighting designs by material substitutions, nor is there a detailed explanation and/or safety and functionality simulation, which are necessary for such design changes. The UCSB Model is a black box showing only generic material compositions of baseline vehicles and some mysteriously selected substitutions with distorted substitution rates. As a result, it leads to a false advantage for steel.
To conduct a comparative LCA, one must first identify products that are comparable. In automotive lightweighting studies, the majority focus on comparing new or conceptual lightweight products with a heavier one with the same functionality. The heavier product often serves as a baseline for comparison. The products compared can be in production, new designs, or in rare cases, a concept without solid design and engineering basis. The product in production is the most meaningful and reliable, followed by a design or simulated design, and then the concept. This is because a product in production usually has concrete measured data to support its reliability (e.g. dimension, material composition, weight of components, fuel economy, etc.), while data for a concept is simply relying on assumptions and serves as a tool for reference for evaluating possibilities.
For a conceptual lightweight product, one must estimate mass. Mass is the foundation for calculating life cycle environmental footprint—lighter vehicle leads to smaller footprint; heavier vehicle leads to bigger footprint. Mass estimation for conceptual product is concentrated on assuming the percentage of mass reduction achievable through material substitution, provided that the functionality of the new product will be maintained or improved compared to the baseline. The percentage is called a mass reduction coefficient (MRC). The rate usually refers to the potential of an average component-to-component substitution without taking into consideration any system optimization. The rate is largely based on empirical data by incorporating material property specifics, such as density, strength, formability, formation, and joining techniques. The reciprocal of the MRC is the MSR (e.g., MSR = 1-MRC). The terminology used by the UCSB Model warrants special attention. There, the MSR is called material replacement coefficient and is abbreviated as MRC. It should not be confused with the MRC used by this paper because the two are precisely the inverse of each other in value.
The UCSB Model is built to compare lighter conceptual products with heavier conceptual products, using material substitutions to replace part of the vehicle system, which is not identified or explained, while keeping the rest of the system unchanged. Since it is neither a real design, nor does it use any computer-aided simulation tool to optimize the system, the model simply adopts a one-size-fits-all default MSR for each of the lighter weight materials to replace the steel counterparts of the baseline.
It is not easy to determine an appropriate one-size-fits-all MSR for a lighter material to replace a heavier material system. In the real-world context, MSR is not only related to the intrinsic properties of the material, especially density and strength, but also to other factors such as cost, compatibility with other components, manufacturing platform, forming and joining techniques, system optimization potential, etc. The rate usually varies significantly from component to component. Assessing the appropriateness of such rate selection for a specific study is a challenging task. Nevertheless, one can still objectively evaluate the UCSB Model by comparing the choice of its MSRs with empirical data, prevailing design examples, and LCA literature listed in Table I.
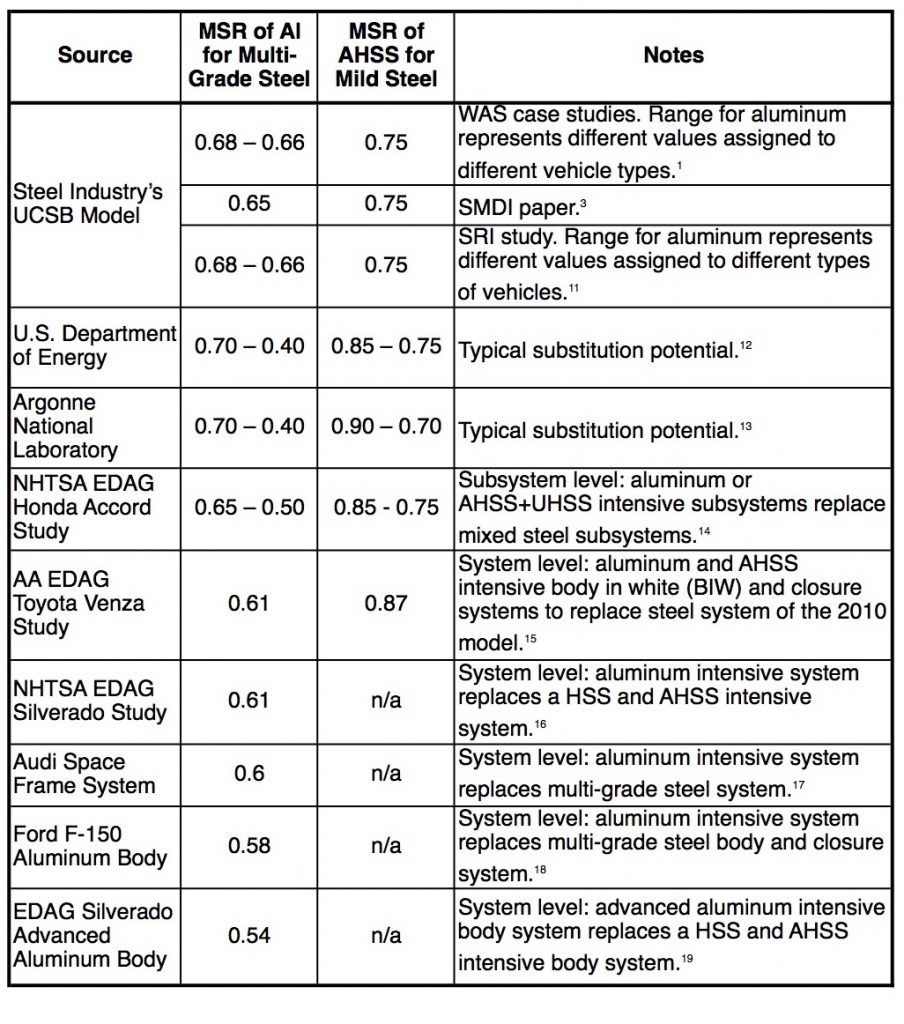
The data clearly demonstrates that when compared with other commonly recommended or design-achieved MSRs, the steel industry’s value underestimates the technical ability of aluminum and overestimates AHSS for mass reduction. As a result of such a distorted selection of MSRs, the difference of mass between AHSS and aluminum-intensive vehicles has been artificially reduced. Weight difference is the foundation for difference in life cycle environmental footprint between the two material solutions.
Jarod Kelly and his colleagues at the Argonne National Laboratory (ANL) reviewed multiple sources of data for material substitution rates and decided to utilize a range for their paper. The authors believed that the range reflected “the most representative of actual practice.”13 The range for AHSS was 0.9–0.7 kg/kg steel, and for aluminum was 0.7–0.4 kg/kg steel.
In a separate study, Qiang Dai and his colleagues (another ANL research team) examined historical trends and future potential of both average curb weight and material composition of U.S. light-duty vehicles.20 The average weight reduction potential of different materials is depicted in the study through literature review and data compilation. The study again reinforces the 15–25% (MSR 0.85–0.75) and 30–60% (MSR 0.7–0.4) ranges for the two materials AHSS and aluminum, respectively.
Most design experience shows that aluminum intensive systems have a substitution rate of 0.6 and thus can shed 40% of the mass of a multi-grade steel system. This can be verified by the Honda Accord (sedan), Toyota Venza (SUV), and GM Silverado (light truck) studies mentioned in Table I, as well as the real production experiences of Audi’s Space Frame System for sedans and Ford’s F-150 body and closure system for light trucks. The latest advanced aluminum automotive alloys developed by several companies (e.g., Arconic’s Micromill™, Novelis’Advanz™, Aleris’ Structurlite® 400, and Constellium’s HSA6® and Formalex® series of products) help further improve the strength of the metal and lead to more mass reductions. This is reflected in the most recent study by EDAG on the baseline of MY2014 Chevrolet Silverado.19 The study concludes that the advanced grade aluminum can reduce the system mass of body and closure by 46%.
The case of AHSS replacing lower-strength steel systems is more complex because most baseline vehicles already use high strength steel extensively. An AHSS-intensive system may be able to shed as much as 25% weight of a conventional steel system. However, complexity increases when it comes to a system that is already HSS intensive. In that case, the potential for mass reduction for AHSS is roughly 10%.
Mass-Induced FRV
Mass-induced FRV is considered the next most critical factor besides material substitution rate for automotive lightweighting LCA. For internal combustion engine vehicles (ICEV), more than 80% of the life cycle energy consumption and GHG emissions are attributed to the use phase of the vehicle.21 Any small change to the fuel consumption factor will have a significant impact on the results.
In lightweighting LCA studies, practitioners face choices for the use phase energy consumption factor. They can use real fuel efficiency parameters for production models (e.g., mileage per gallon or liter per 100 km) or use an operable mass-to-fuel correlation parameter for new designs and design concepts. The mass-to-fuel correlation parameter needs to be “operable” to avoid ambiguity. This operable parameter is often called mass-induced FRV. It is an absolute fuel volume or energy value number on a per unit mass reduction and per unit distance driving basis. It is often expressed as mega-joules (MJ) or liter of fuel per 100 kg mass reduction for per 100 km distance of driving (MJ or L/100kg*100km). The FRV can be used to calculate the energy impacts of lightweighting for both systems and individual components, providing the assumption of equal contribution of mass to fuel consumption by all components of the vehicle.
There are two distinct situations in which the FRV can be significantly different. The first is a material substitution without engineering optimization for the system or for the full vehicle. This usually happens with limited lightweighting of individual parts, leading to an insignificant weight reduction. It also happens when the mass reduction is largely offset by a weight increase somewhere else, e.g., adding new electronic or safety components. The second is material substitution plus system or full vehicle optimization, usually involving system integration and powertrain adjustment (resizing). The result is often a smaller engine or more efficient powertrain for the lighter vehicle to maintain the same performance as the heavier one, leading to more fuel consumption reduction.
Table II lists FRVs from different studies, with notes adding details about the exact situations in which the values are applied. In the area of FRV, the Koffler, et al., study is among the most cited literature and its FRV values are among the most commonly agreed and recommended. The study used a mathematic model to calculate a value of 1.95 MJ/100 kg*100 km for mass-induced energy demand. This is the equivalent of 0.15 liter/100 kg*100 km of gasoline consumption to provide the energy for the non-powertrain-adjustment lightweighting scenario and 0.35 liter/100 kg*100 km for the powertrain-adjustment lightweighting scenario.22
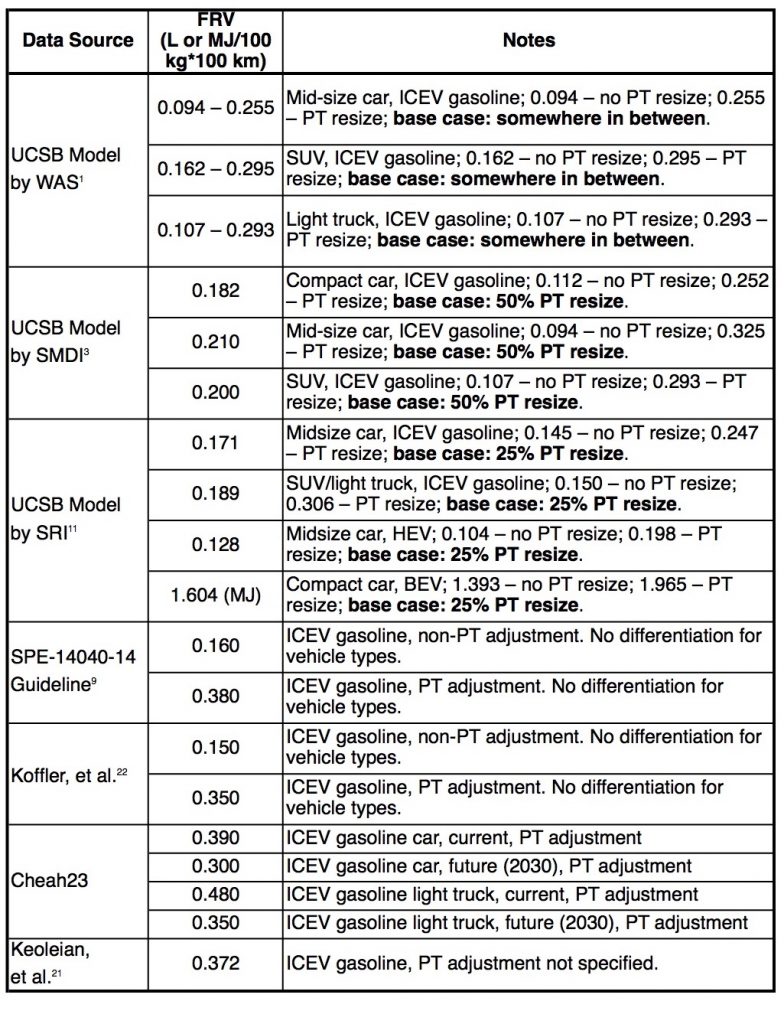
The values recommended by Koffler, et al., are based on the New European Driving Cycle (NEDC), which is intended to represent the typical passenger car usage in Europe. The North American driving cycle is different, with the U.S. Federal Test Procedure (FTP) and Highway Fuel Economy Driving Schedule (HWFET) representing city and highway driving. The standard U.S. EPA combined fuel economy (CFE) sets 55% city and 45% highway driving. For this reason, the SPE-14040-14 guideline recommended an FRV for naturally inspired gasoline engine vehicle of 0.16 liter/100 kg*100 km and 0.38 liter/100 kg*100 km for lightweighting scenarios in which the powertrain was not resized and was resized, respectively.
Cheah conducted a comprehensive analysis on the relationship between mass reduction and fuel consumption in her doctoral thesis paper.23 Through three different approaches of analyses including literature review, empirical data analysis, and computer simulation, she recommends two sets of FRVs for powertrain adjusted systematic lightweighting solutions—one for current and near-term, and the other for the future (2030). The two sets of values are 0.39 (current) and 0.30 (future) and 0.48 (current) and 0.35 (future) for cars and light trucks, respectively.
Looking at the steel studies, a common feature is that the FRVs are noticeably lower than recommended by others. The consequence of such noticeably lower FRVs is distorted inflation of fuel consumption for the lighter vehicle and a false advantage for the heavier vehicle, which is steel product intensive. Given the significance of the use-phase in the life cycle footprint (more than 80% for ICEV), an increase in the FRV alone could reverse the results of the steel studies. This is reflected in the SRI study through its sensitivity analysis results. The report provided an example for the SUV case in which the results are reversed when FRV is increased from 0.189 to 0.306 (from 25% PT resizing to 100%). In this case, the elasticity for change in difference between AHSS and aluminum intensive vehicles in both energy and GHG as a result of change in FRV is -2.2 (∆, = ∆,-2 − 1 × ∆-2 − 1) and -10.8 (∆, = ∆,2 − 1 × ∆2 − 1), respectively. Note that the 100% PT resizing value selected by SRI for the SUV case is 19% lower than the recommended value by SPE-14040-14 guideline. If the study had adopted the recommended value, the resulted difference would have been even more dramatic.
LTDD
The LTDD is another parameter that directly affects lightweighting LCA results. Since lightweighting helps save energy, the longer the LTDD, the more energy savings during the use phase, and thus the less net life cycle energy demand and GHG emissions for the lightweight vehicle.
Appropriate LTDD usually comes from empirical data. The average LTDD is not only related to vehicle types (e.g., cars versus light trucks, mass production vehicles versus luxury vehicles, etc.), but also temporal and spatial factors. The most appropriate data source for LCA is statistical information. In Europe, assumption-based LTDD for a mass production vehicle usually ranges between 150,000–200,000 km by most studies, while in North America, the value is 250,000 km for passenger cars, and 290,000 km for SUV and light trucks based on NHTSA vehicle survivability statistics,24 as recommended in the SPE-14040-14 guideline.
The UCSB Model used an LTDD of 200,000 km for most of the vehicle types for base cases.10 NHTSA statistical values have been adopted by the SMDI and SRI papers for base cases for North American situations.3,11
EOL Allocation Method and Material Recovery Rates
The EOL allocation method and material recovery rates also heavily affect the results of a study. The environmental footprint of the EOL phase of a vehicle can be accounted through different allocation methods. One method is cut-off or recycled content approach and the other is avoided-burden or EOL recycling approach. Most automotive lightweighting LCAs use the EOL recycling approach based on the intrinsic high recyclability characteristics of major automotive materials as well as the significant role of recycling in reducing the overall life cycle footprint. The SPE-14040-14 guideline recommends using the EOL recycling approach as well.
The EOL recycling approach accounts for the burdens of the primary materials used to make auto parts and the burdens of recycling. At the same time, it gives net credits for materials recovered during the recycling process. The credits help offset the initial manufacturing burdens and therefore lower the total life cycle footprint of the vehicle. The higher the recovery rate of a material, the lower the total footprint.
The UCSB Model treats the allocation approach through a parameter setting named α. The value of the parameter can be chosen from 0-1, depending on how much weight is assigned to between the two prevailing allocation methods of cut-off/recycled content and avoided-burden/EOL recycling.
Consistent with the global metals industries, most of the steel industry’s studies from the model adopted a unanimous avoided-burden/EOL recycling approach. This includes the WAS case studies and the SMDI paper. In the SRI paper, however, the α was set for three different values to give results in three distinctive allocation methods: avoided-burden/EOL recycling, cut-off/recycled content, and 50/50 (a hybrid of avoided-burden and cut-off methods). SRI called it an “agnostic approach” and it is a fundamental shift away from its traditional position.
Before examining the possible motivation behind SRI’s dramatic shift in allocation methodology, it’s important to understand the inherent biases in the UCSB Model. This is reflected by the different rates assumed for aluminum and steel:
- Steel – collection rate of 97%, shredder loss of 2%, melting loss of 5%, and combined metal recovery rate of 90.3%.
- Aluminum – collection rate of 97%, shredder loss of 10%, melting loss of 10%, and combined metal recovery rate of 78.6%.
These assumption-based rates are highly subjective with no supporting evidence. The vehicle recycling process involves dismantling, shredding, downstream separation, and remelting and recovery. Both automotive aluminum and steel are processed on the same recycling platform during the material collection stage. Theoretically, researchers can make assumptions about material losses at each of the steps if no solid statistical or research data is available. However, assumptions in such a situation have to be reasonable and close to truth.
The collection rate used by the UCSB Model is the rate of which vehicles are eventually recycled. There is no accurate statistical information for such a rate in most countries. Thus an assumption of 95–100% is often used in LCA studies. It is worth mentioning that in most countries and jurisdictions, automobiles are required by law to be recycled at EOL, and there are real economic incentives for owners to recycle them. But if a retired vehicle is not recycled “in time,” it would not end up in landfill either. There are cases in which retired vehicles are smuggled out of developed countries to be reused in developing countries. In such case, vehicles are not considered as lost in landfill either. For this reason, the Aluminum Association uses a 100% rate assumption for the collection of automobiles in its auto aluminum recycling studies. Similarly, the SPE-14040-14 guideline also recommends using 100% for collection rate.
For the very different rates of loss assigned to aluminum and steel for the shredding and melting processes by the UCSB Model, research shows such numbers are baseless. The Aluminum Association sponsored two automotive aluminum recycling studies. The studies were conducted by the Center for Resource Recovery and Recycling (CR3) at Worcester Polytechnic Institute. The first study conducted surveys at recycling facilities to analyze operational efficiency and thus the level of material recovery at each of the recycling steps. The second study collected samples from the recycling facilities and conducted laboratory testing to calculate metal recovery efficiencies of the relevant recycling steps. Both studies concluded that the ultimate aluminum recovery efficiency throughout the processing steps is more than 91% and could be as high as 96%.25-26 The majority of metal loss happens at the melting step. Loss in the shredding step is less than 1%.
The SPE-14040-14 guideline makes very clear recommendations for the EOL material recovery rates (called “yield”) after consulting all involved industries during the rule making process. The recommended yield for both aluminum and steel is 95%, which is proved very close by the CR3 study.
When it comes to SRI’s dramatic methodology switch, one reason stated in its report is the allocation methods for the fate of materials at the EOL has been continuously debated in the LCA community with no clear conclusion. This is true since the allocation method is largely a value choice depending on the characteristics of materials and the level of environmental attributions of recycling to save natural resources and reduce life cycle impacts of products. The steel industry, together with aluminum and other metals, has been strongly advocating for the EOL recycling approach. The industries jointly released a declaration in 2007 elaborating why the EOL recycling approach is important in LCA allocation for metals.27
Another reason given is related to “material down-cycling” during the recycling process. Down-cycling happens to all materials in real-world recycling systems. For metals that are, in theory, perfectly recyclable, down-cycling could happen due to impurities from alloying elements and contamination from other materials. This is true for all metals including steel, copper, aluminum, nickel, zinc, etc.
Looking at the results listed in the tables of section 5.1 Base Case Results,11 it is not hard to speculate the true intention behind the methodological shift. Following aforementioned bias on other critical factors, the results based on the avoided-burden allocation method, which is the steel industry’s traditional value choice corresponding to the recyclability of metals, were tied between AHSS and aluminum. At this stage, it seems that the last option open for the steel industry was to change the allocation methods. As a matter of fact, the results of other allocation methods are highly dependent on scrap input (recycled content) for each of the materials during manufacturing process. The scrap input for aluminum (sheet and extrusion products) was assumed to be 11% based on the GREET Model, of which the source of data can be traced back to a study conducted by the Aluminum Association more than two decades ago. Automotive aluminum product manufacturing technology has been significantly improved during the past two decades and we estimate that scrap inputs for both auto sheet and extrusion are at least two times higher today. For instance, Ford reports that its closed-loop aluminum stamping scrap recycling arrangement has enabled the displacement of one-third of primary aluminum.28
LCI or LCIA Data for Aluminum
The LCI or LCIA data for raw material production is another influential factor in comparative studies, particularly for the production phase of the life cycle. For automotive lightweighting, the data for materials shall represent the common situation as well as the prevalent practice of material sourcing by the automotive manufacturers, making data coverage and representativeness particularly important.
Large quantities of steel and aluminum are commonly sourced from multiple manufacturers and production sites. These production sites are usually concentrated in geographic areas that are close to where the vehicles are assembled. From this perspective, a good set of data for such materials should represent the average environmental profiles of material production of the industry. It should also be sensitive to time and geographic locations. If a dataset represents the global situation, while the study is intended to analyze a certain region for decision making purposes, the dataset is deemed not representative. Likewise, if a study is intended for future decision making while the selected dataset is old enough to represent the remote past, the selection is not good either. Due to the importance of data selection for materials for lightweighting, the SPE-14040-14 guideline sets additional rules based on top of the requirements by ISO 14040/44.
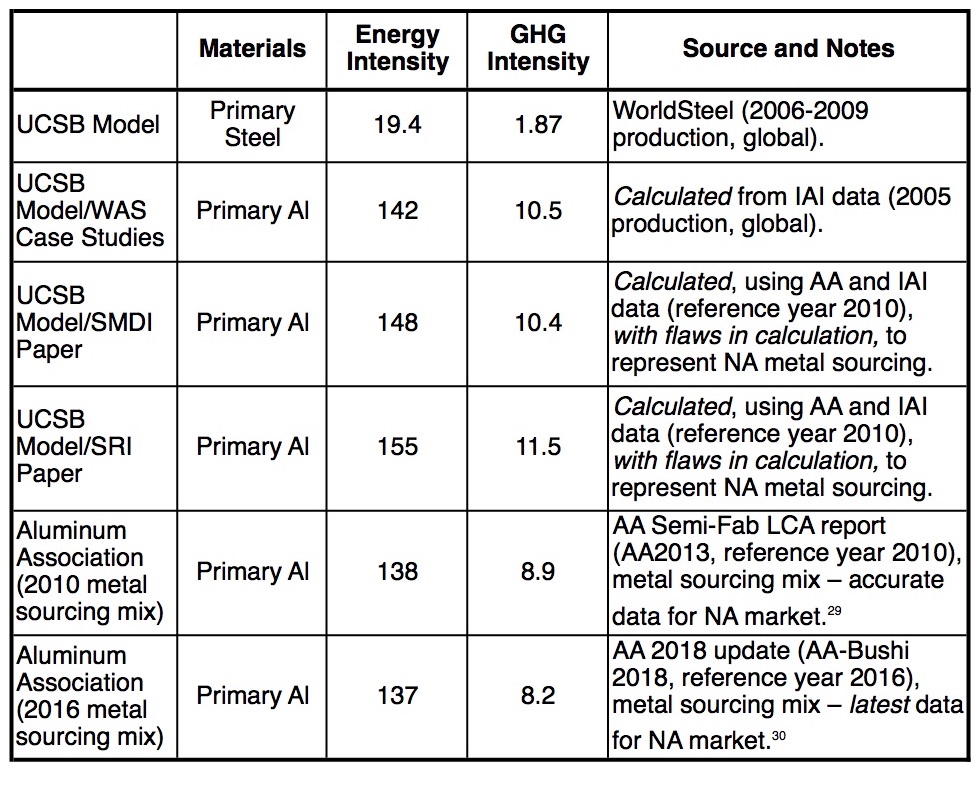
Table III shows the LCI/LCIA values of energy and GHG for primary steel and primary aluminum used by steel industry studies in comparison with the more accurate North American aluminum data. The data for primary metal are the most important in terms of impact on the footprint of the vehicle production stage, which is part of AISI’s comments for the CAFE/SAFE rule making process. Data for recycled metal and metal semi-fabrication is also important. However, in terms of sensitivity to change, its relative impact on the results is minor.
In addition to data for primary metals, the recycled content of metals is also highly sensitive to the results of the production stage footprint. It does not, however, affect the results of the full life cycle footprint, if the avoided-burden allocation approach is adopted. The situation would change if the cut-off allocation method were to be chosen. In such a case, the level of recycled content will affect the results of the full life cycle.
As shown in Table III, although the SMDI and SRI studies attempt to adopt energy and GHG intensity values for North American primary aluminum, instead of directly using the more accurate data from the Aluminum Association, they chose to do it with a false calculation, which results in up to 30% inflation. As a consequence, the production stage footprint of the aluminum intensive vehicle is exaggerated.
Communication Violations by the Steel Industry
In addition to its technical manipulations to make AHSS look better than aluminum, the steel industry also ignores basic rules and principles set by the ISO 14040/44 and ISO 14021/25 standards regarding how its studies can be communicated and promoted. The most severe violation, represented by AISI in both its public communications and comments for the SAFE rule making process, is to claim steel is a better material than aluminum by comparing the carbon intensity of primary metal production on a per kilogram basis without referring to the specific functions and their related functional units. Aluminum is three times less dense than steel, and a part made of aluminum typically weighs half of a steel part of equal functionality. Additionally, aluminum auto parts are made of both primary and recycled metals, and the carbon intensity of recycled aluminum is only a tiny fraction of primary metal.
The second violation is making comparative assertions without detailed reporting of its study and without a rigorous critical review process. ISO standards have clear requirements for making LCA based claims or comparative assertions (ISO 14040, Clause 7.2-7.3 and ISO 14044, Clause 5.3). Requirements include defining the circumstances and conditions of the claims, explaining the study processes, showing the supporting materials and documents, and elaborating limitations and uncertainties. There is no evidence to show any of the requirements were fulfilled by the WAS case studies.
The SMDI paper can best be described as a brief summary aimed for promotion, with many of the necessary information and explanations missing, and with no evidence to show that it received critical review. In addition, the report attempted to make sensational claims by expanding its conclusions on single vehicle types to the entire fleet of all vehicles on the road without considering the extremely diversified brands, technology differences, models, and performances.
In the SRI study, improvements were made by releasing a more detailed report and having it go through a rigorous critical review process. However, subtle communication violations still exist. For instance, the conclusions claim that lightweighting with aluminum compared to AHSS resulted in a “significant increase” in production stage GHG emissions without mentioning that such a result is largely dependent on the level of scrap input for the metals. Further, claiming that production stage emissions were not offset by the use phase gains until a very late time during the life cycle is also highly misleading.
Conclusion
This assessment on the steel industry’s problematic practice is similarly summarized by the U.S. Environmental Protection Agency researchers in their automotive LCA review paper, which stated:8
Unlike the other LCAs, the study by the Steel Market Development Institute found that AHSS had the lower life cycle energy and GHG impacts compared to aluminum as a material for vehicle mass reduction (Steel Market Development Institute, 2016). This finding was also true for two ‘case studies’ by World Auto Steel, although these studies were not included in the selected LCAs in Table I because they were based heavily on variable selection within a specific tool and lacked sufficient rationales for the selected inventories or explanation of the methodologies used (World Auto Steel, 2014a,b). While these findings are not consistent with other reviewed LCAs that compare AHSS/HSS to aluminum, the Steel Market Development Institute used a publicly available model and data from both the steel and aluminum industries when possible. The differentiation between the findings of this LCA and others is the result of divergent assumptions…. The values applied as assumptions in the SMDI study may fall into plausible ranges but consistently represent factors that generate favorable results for steel over aluminum. Assumptions from reports that have divergent results from the majority of the literature need to be carefully analyzed so that they can inform rather than detract from the larger scientific consensus.
The Aluminum Association supports the good intention of comprehensive environmental assessment by introducing life cycle thinking and LCA into business decision making processes. However, the Association raises strong concerns on the practices of automotive LCA by the steel industry to mislead the public. In the opinion of the Association, such practices are not responsible and may be counterproductive. The future of transportation and mobility is not going to be built solely upon one individual metal. Rather, it is going to be a multi-material world in which every material, including both steel and aluminum, a range of key technologies, and the full spectrum of the supply chain will have a significant role to play.
Aluminum takes this charge seriously and the Aluminum Association urges the steel industry to challenge itself to conduct studies that are more scientifically sound and better reflect industry advancements and innovations.
References
- Multiple Life Cycle Assessment Case Studies: Sedan, Sports Utility Vehicle, Light Duty Truck, and Battery Electric Vehicle Cases, World Auto Steel (WAS), 2013–2017.
- Comments on EPA and NHTSA Reconsideration of the Mid-Term Evaluation of Greenhouse Gas Emissions Standards for MY 2022-25 Light-Duty Vehicles, American Iron and Steel Institute (AISI), 2017, Docket ID Nos. EPA–HQ– OAR–2015–0827 and NHTSA–2016–0068.
- “The Importance of the Production Phase in Vehicle Life Cycle GHG Emissions,” Steel Market Development Institute (SMDI), 2016.
- ISO 14040, Environmental Management – Life Cycle Assessment – Principles and Framework, International Organization for Standardization (ISO), 2006.
- ISO 14044, Environmental Management – Life Cycle Assessment – Requirements and Guidelines, International Organization for Standardization (ISO), 2006.
- ISO 14021, Environmental labels and declarations – Self-declared environmental claims – Type II environmental labeling, International Organization for Standardization (ISO), 2016.
- ISO 14025, Environmental labels and declarations – Type III environmental declarations – Principles and procedures, International Organization for Standardization, 2006.
- Hottle, Troy, et al., “Critical Factors Affecting Life Cycle Assessments of Material Choice for Vehicle Mass Reduction,” Transportation Research, Part D 56, 2017, pp. 241–257.
- SPE-14040-14, Life Cycle Assessment of Auto Parts – Guidelines for Conducting LCA of Auto Parts Incorporating Weight Changes Due to Material Composition, Manufacturing Technology, or Part Geometry, CSA Group, 2014.
- UCSB Model v5 2017, Automotive Energy and Greenhouse Gas Model, University of California, Santa Barbara, 2017.
- “Life Cycle Greenhouse Gas and Energy Study of Automotive Lightweighting,” Steel Recycling Institute, 2018.
- “Timeline: A Path to Lightweight Materials in Cars and Trucks,” Vehicle Technologies Office, U.S. Department of Energy, 2016.
- Kelly, Jarod C., et al., “Impacts of Vehicle Weight Reduction via Material Substitution on Life-Cycle Greenhouse Gas Emissions,” Environmental Science & Technology, Vol. 49, 2015, pp. 12,535–12,542.
- Singh, Harry, “Mass Reduction for Light-Duty Vehicles for Model Years 2017-2025,” EDAG Inc., prepared for National Highway Traffic Safety Administration (NHTSA), August 2012, Report No. DOT HS 811 666.
- “Toyota Venza Aluminum BIW Concept Study,” EDAG and The Aluminum Association, April 2013.
- Singh, Harry, “Mass Reduction for Light-Duty Vehicles for Model Years 2017-2025” (draft), EDAG Inc., prepared for National Highway Traffic Safety Administration (NHTSA), April 2016.
- “The Audi Space Frame Technology – Milestones Since 1994,” Audi, 2017.
- “2015 North American Light Vehicle Aluminum Content Study,” Ducker Worldwide, June 2014, prepared for The Aluminum Association.
- “ATG Silverado Lightweighting Study,” EDAG and the Aluminum Association, February 2017.
- Dai, Q., et al, “Vehicle Materials: Material Composition of U.S. Light-duty Vehicles,” Argonne National Laboratory, September 2016.
- Keoleian, Gregory A. and John L. Sullivan, “Materials challenges and opportunities for enhancing the sustainability of automobiles,” MRS Bulletin, Vol. 37, April 2012, pp. 365−372.
- Koffler C. and K. Rohde-Brandenburger, “On the calculation of fuel savings through lightweight design in automotive life cycle assessments,” International Journal of Life Cycle Assessment, Vol. 15 (1), 2010, pp. 128−135.
- Cheah, Lynette W., “Cars on a Diet: The Material and Energy Impacts of Passenger Vehicle Weight Reduction in the U.S.,” Massachusetts Institute of Technology, September 2010.
- “Vehicle Survivability and Travel Mileage Schedules,” National Center for Statistics and Analysis, NHTSA, January 2006.
- Kelly, Sean and Diran Apelian, “Automotive Aluminum Recycling at End of Life: A Grave-to-Gate Analysis,” Worcester Polytechnic Institute (WPI), 2016.
- Kelly, Sean and Diran Apelian, “Processing Loss of Automotive Aluminum Scrap: Analysis of Landfill Flows and Metallic Yield,” Worcester Polytechnic Institute (WPI), 2018.
- Atherton, John, et al., “Declaration by the Metals Industry on Recycling Principles,” International Journal of Life Cycle Assessment, Vol. 12 (1), 2007, pp. 59–60.
- Chappuis, Laurent, “Material Specifications and Recycling for the 2015 Ford F-150,” Society of Automotive Analysts, 2015.
- “The Environmental Footprint of Semi-Finished Aluminum Products in North America: A Life Cycle Assessment Report,” The Aluminum Association, December 2013.
- Bushi, Lindita, “EDAG Silverado Body Lightweighting Final LCA Report,” The Aluminum Association, August 2018.
Editor’s Note: This article first appeared in the April 2020 issue of Light Metal Age. To receive the current issue, please subscribe.