By Andrea Svendsen, Managing Editor.
In April, the National Coil Coating Association (NCCA) hosted its 2026 annual meeting, bringing coil coaters and suppliers to the coil coating process together to discuss the latest economic and industrial trends. In addition to hosting the NCCA’s annual business meeting, with updates from the Statistics, Technical, and Environmental, Health, and Safety Committees, the event provided insights on the North American economic outlook, the aluminum market, an educational seminar on employee retention, and other technology and application insights.
Economic Outlook
In his keynote presentation, Dr. Anirban Basu, Sage Policy Group, Inc., discussed the difference between the global sentiment (how people perceive the economy) and what is being projected regarding economic growth. Basu explained that current predictions expect a U.S. GDP growth of 1.5–2.5% in 2026, with most of this growth coming from investment assets, such as artificial intelligence (which is seeing booming stock prices), the stock market, etc. However, he pointed out that there will also be more discussions about recessions, because while Wallstreet is doing fine, mainstream consumer sectors are a bit rocky.
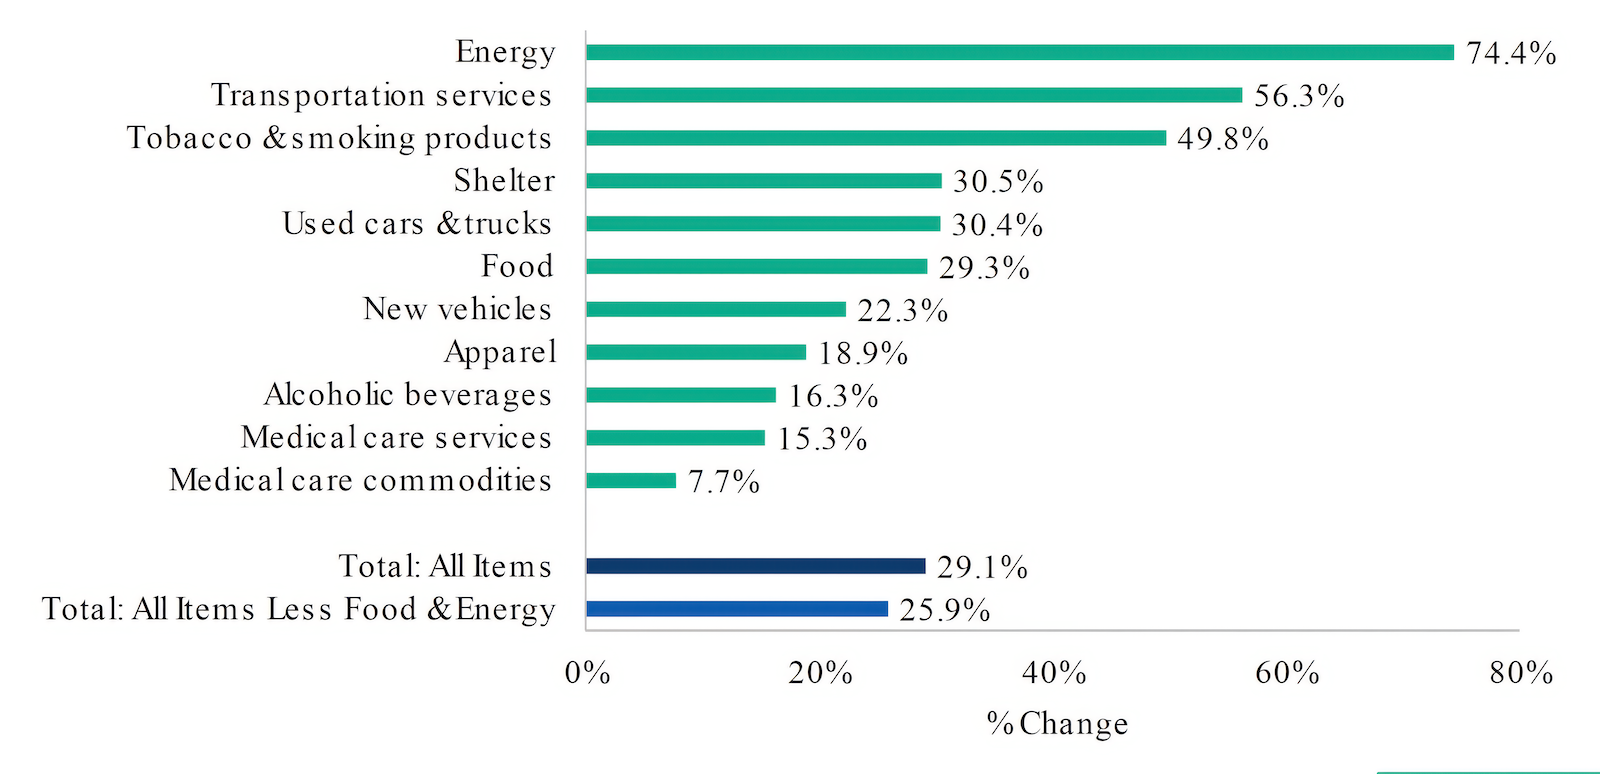
According to Basu, the U.S. has seen significant inflation from May 2020 to May 2026 (Figure 1). Energy saw the highest price increase of 74.4% (not including increases in April 2026 caused by the Iran Conflict), with total increases in pricing over this period being around 29.1%. At the same time, the job market has been increasingly erratic in recent years, and there have been loan delinquency surges, as consumers fall behind on their payments. The combination of these elements results in people having negative thoughts on the economy.
Basu noted that, despite ongoing housing shortages, investment in new buildings has decreased due to high material costs, increased labor costs, and a lack of available workers (caused in part by changing immigration policies). And though housing costs may be slowly dropping, many interested home buyers still cannot afford them.
Commercial buildings have also seen a decrease in new construction spending, particularly in large cities, where there is a high vacancy rate in commercial buildings. This is due to several factors, including high material costs, as well as ongoing work from home policies and people leaving cities and moving to other lower-cost regions. As a result, companies are selling office buildings and commercial structures at a loss.
In summary, Basu explained that forecasts of GDP growth in 2026 come with risks, including inflation coming back because of tariffs and the Iran War, high interest rates in the long term, and the question of overextended assets (AI, stocks, bitcoin, etc.). The reality is that many consumers are financially exhausted, and circumstances could worsen over time.
Aluminum Market
The second day of the event included an aluminum panel, featuring presentations and discussions from Cameron Clark, Midwest Metals; James Parks, Jupiter Aluminum; Davide Ricci, Novelis; and Kaustubh (KC) Chandorkar, Chandorkar Consulting LLC. The group discussed the impact of the Midwest Premium, imports and regulations, flat rolled aluminum demand, and end market trends for aluminum coil.
Midwest Premium
Clark presented on “Midwest Ingot Dynamics and Its Implications,” explaining the difference between the London Metal Exchange (LME) pricing, which is an international commodities market for aluminum futures, and the Midwest Premium, which represents the all-in cost to deliver primary aluminum to the Midwest market. In addition to the cost of the aluminum, this premium includes the freight, handling, warehousing, tariffs, etc., as presented by Platts and other price reporting agencies. So, the actual cost for the coil on a paint line includes the LME cost, the regional premium, and any conversion costs (such as fabrication, alloying, packaging, delivery, etc.).
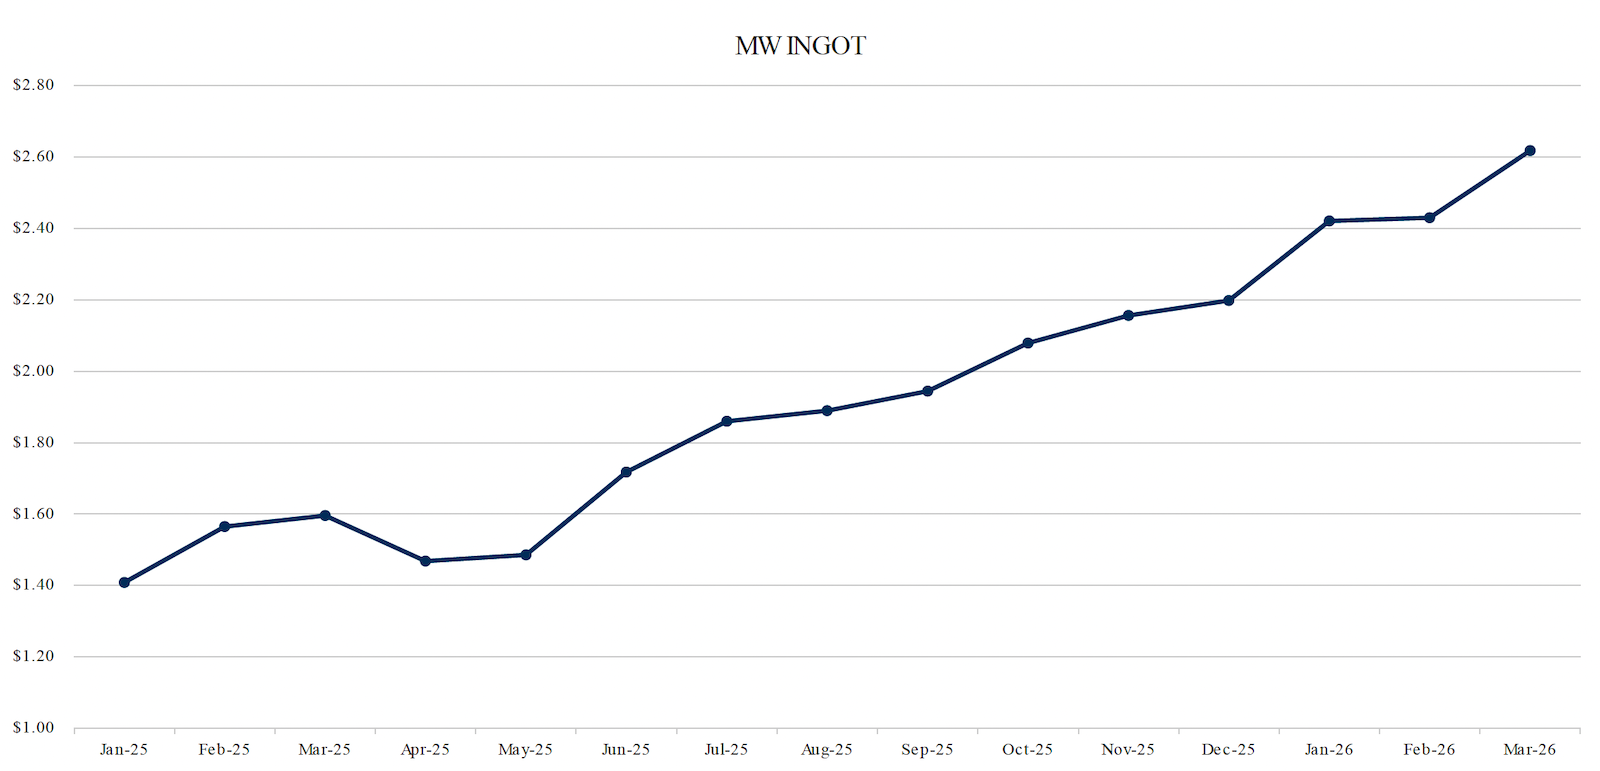
Clark noted that the LME average price increased by 30% from January 2025 to March 2026, while the Midwest Premium spiked 350% in the same period. Together, this resulted in a Midwest ingot price increase of more than 80% (Figure 2). To put it into perspective, he explained that a 40,000 lb shipment of aluminum ingot, which cost $56,329.16 in January 2025, increased to $104,716.40 in March 2026 — an increase of $48,387.24. The reason for the increased costs include a combination of the Section 232 tariffs, sanctions on Russian aluminum, and the Iran Conflict, as well as ongoing demand, which is rising by 2-3% per year.
The potential implications of these price increases include increased inventory costs, additional credit exposure, the postponement or cancellation of expansion projects, and a market shift to alternative products. For example, one alternative product is aluminum composite material (ACM) panel comprised of aluminum surrounding a thermoplastic/polyethylene core, which is said to have a lighter weight, improved rigidity, reduced panel waviness, and lower cost.
Currently, there are scope rulings underway to determine if imported ACM panels fall within existing antidumping (AD) and countervailing duty (CVD) rules. These rulings could have several impacts, including the down gauging of aluminum sheet used in ACM panels, introduction of new suppliers and countries of origin, and possible price increase pressures. Clark emphasized that this could result in decreased demand for aluminum, coil coating and paint and other chemicals in North America.
Import Landscape
Parks gave a presentation titled, “Understanding Today’s Import Landscape: Duties, Regulations, and Market Impact.” In particular, he focused on the supply disruptions caused by the Iran Conflict, noting that the Middle East represents around 27% of global primary aluminum supply (excluding China and Russia) and provides around 20% of supply into the U.S. The immediate market reaction has been surging aluminum prices, reaching $3,500/tonne on the LME. Parks noted that the Aluminum Association is looking into means of ensuring the safety of workers in the region, finding alternative metal sourcing options, and increasing domestic recycling to help address supply gaps. He noted that aluminum is the center for regional growth in the U.S. particularly with two new rolling mills being installed by Aluminum Dynamics and Novelis.
Flat Rolled Demand
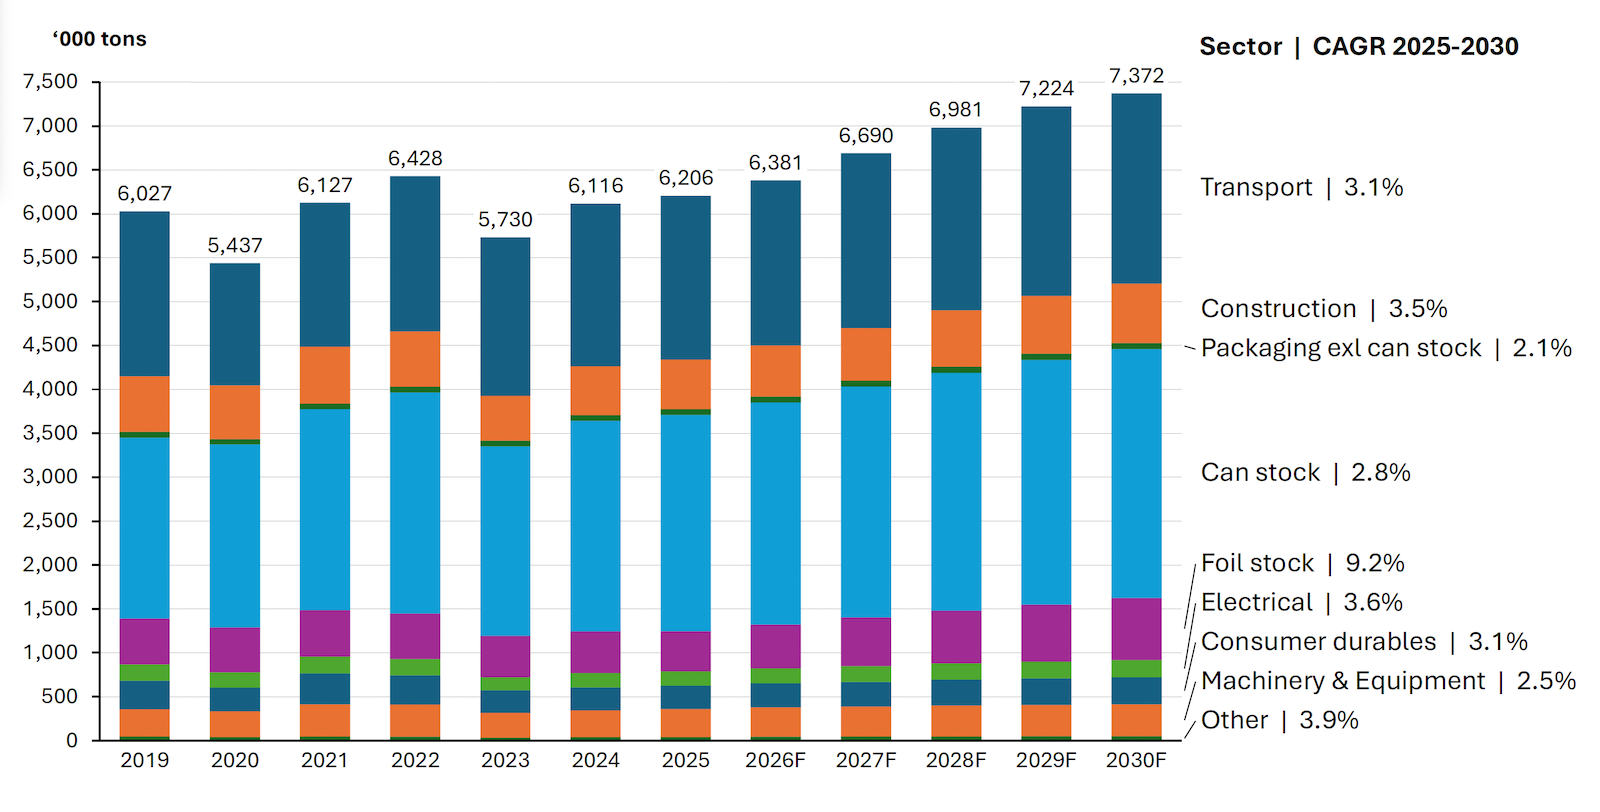
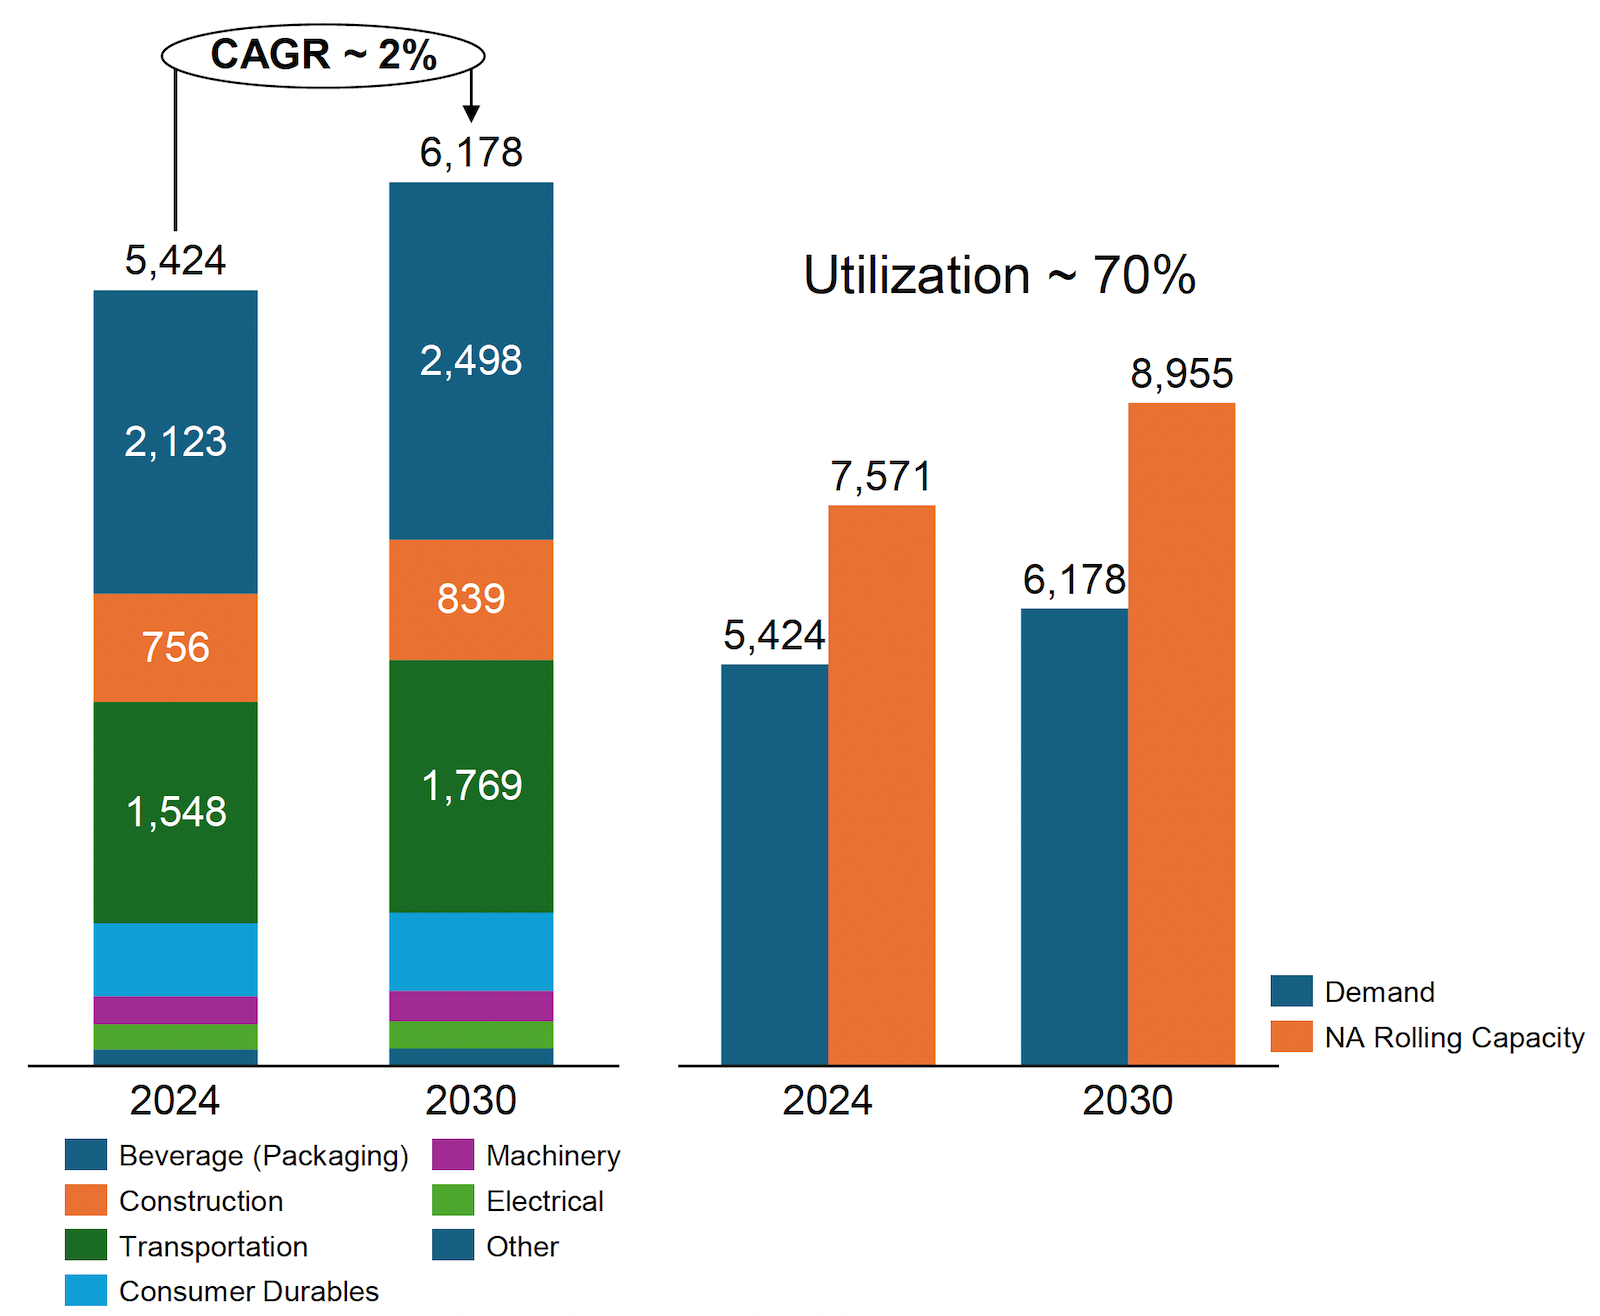
In the presentation, “Navigating Growth in Aluminum Flat Rolled Demand,” Ricci noted that North America is seeing continued increasing demand for aluminum flat rolled products, despite ongoing challenges. Can stock is a major driver of this demand, as well as transportation and construction (Figure 3). However, North America has experienced supply deficits for decades, causing the industry to turn to imports, with around 1 million tons of aluminum imported between 2019 and 2022.
Novelis is working to address this supply gap with the construction of its Bay Minette integrated rolling facility, which is a $5 billion investment expected to create up to 1,000 new jobs. When completed, the plant will produce 600,000 tonnes of finished goods capacity for the beverage packaging and automotive markets. Currently, the company has begun cold commissioning of the site’s cold rolling mill, which is expected to be completed in the second half of 2026. The hot mill is expected to come online in 2027.
End Market Trends
Chandorkar offered the presentation, “Aluminum Market Outlook Through 2030: End-Market Trends for Coil Coaters.” He started with a look at the automotive market, which has been seeing a lot of changes. From 2020 to 2022, the industry saw a 20% decline in vehicle production, which has since stabilized in 2023-2025. Vehicle build rates are holding steady at around 15-16 million vehicles per year, despite tariff-related cost pressures and regulatory changes.
Electric vehicle programs have been pulled in recent years due to a number of factors, including the reversal of the CAFE standards. With the CAFE standards in place, automakers were required to reduce average fuel consumption across their vehicle models by 50 mpg, which meant that 30% of their lineup had to be battery electric vehicles (BEVs). Now, automakers only need to reduce their average fuel consumption by 35 mpg across all their vehicle models, so only 1% of their lineup needs to be BEVs.
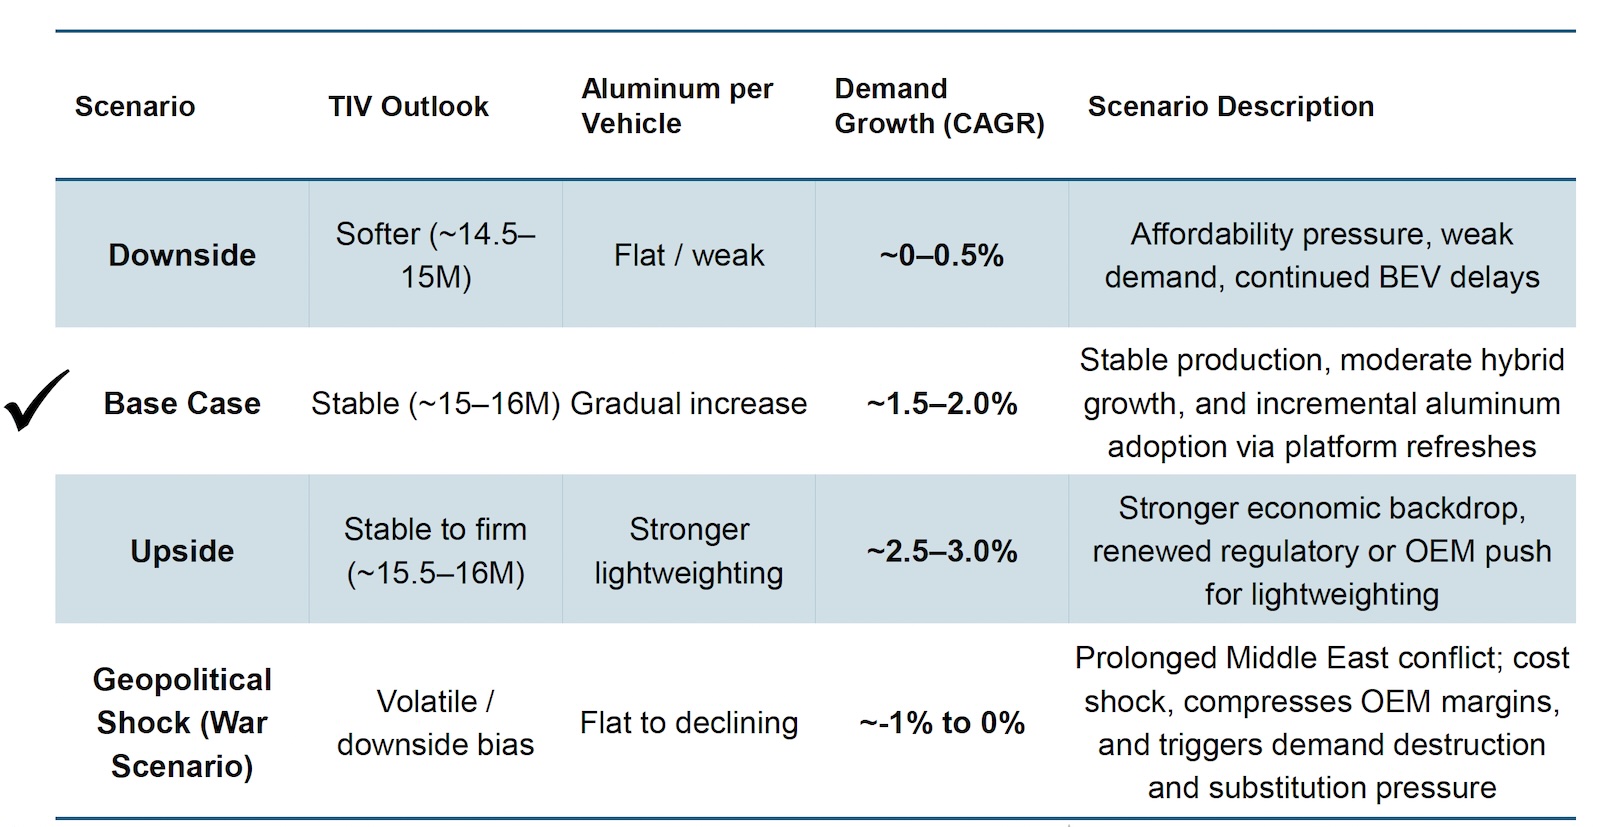
According to Chandorkar, aluminum demand remains relatively stable in the short term, and increased aluminum prices are not likely to lead to material substitutions back to steel. However, the longer aluminum costs and tariffs remain high, the more likely material substitutions are to take place. Fortunately, major automotive aluminum programs, like the Ford F-150, appear to be stable and the base case for aluminum growth per vehicle is likely to be around 1.5-2% (Table I).
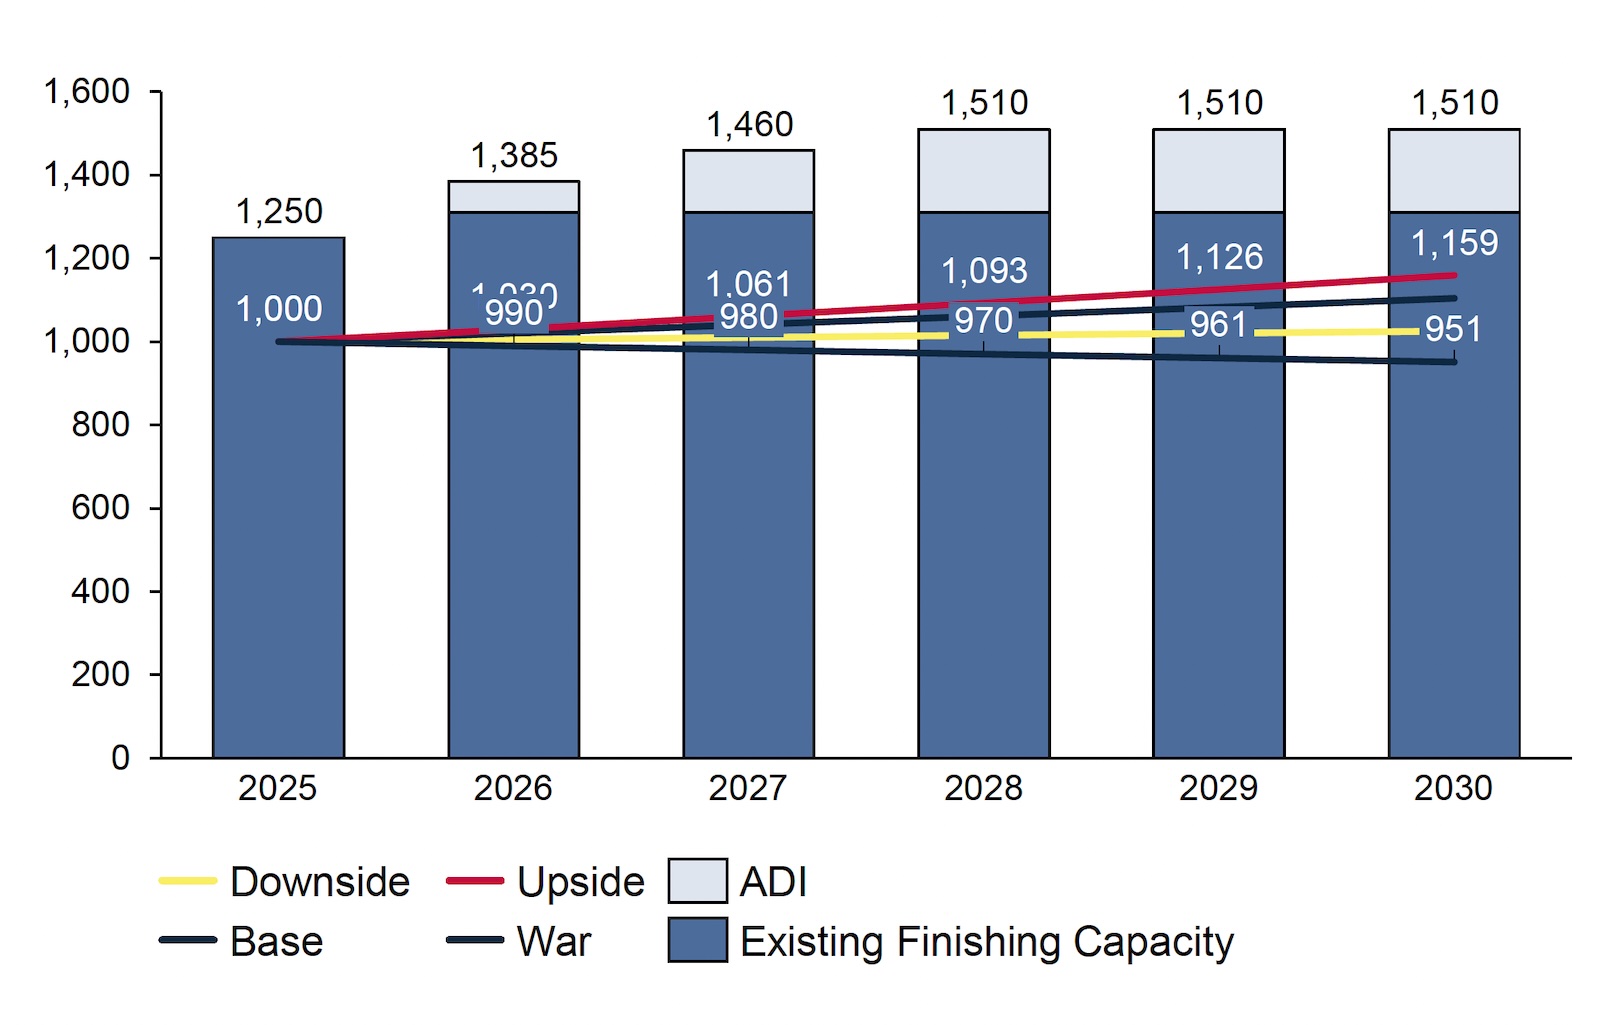
In every scenario model explored by Chandorkar, finishing capacity is an important requirement for meeting automotive aluminum body sheet demand. In 2025, North America had around 1.25 million tonnes of continuous annealing lines with pre-treatment (CALP). With Aluminum Dynamics starting up two CASH lines this year, total North American finishing capacity is expected to increase to 1.5 million tonnes. As a result, North America has sufficient finishing to meet body sheet demand (Figure 4).
The food and beverage packaging market is “rock solid” according to Chandorkar, because the market has not faced as many issues with tariffs, can imports, or platform cycles. As a result, an underlying demand growth of 2-4% CAGR is expected. However, the U.S. has a used beverage can recycling rate of only 43%, which “should be a national shame.”
Building and construction is stabilizing, but is not expected to see any significant growth in the near term. Residential construction is limited by high mortgage rates, with no immediate recovery expected. Commercial construction spending saw intense growth through 2023 due to industrial and data center builds. The commercial market remains active and is holding at high levels, but is no longer growing.
Overall flat rolled product growth through 2030 is expected to see modest growth, depending on the product mix (Figure 5). From a coil coating perspective, the market is shifting from being a growth-driven perspective (production volume) to a competition-driven perspective (based on product mix, positioning, and cost control).
Employee Retention
Tracy Adams, Sherwin Williams, provided an Education Seminar on “Employee Retention and Engagement Strategies for Manufacturers.” Understanding how to hire and retain employees is vital to keep aluminum manufacturing operations running smoothly. According to Adams, the industry is currently facing high employee turnover (26-28%), labor shortages (with more than 5% unfulfilled manufacturing jobs), and engagement decline (25% of manufacturing workers are over 55 years old).
High employee turnover is particularly costly for companies, representing anywhere from $7,800 to $11,900 in recruitment, training, and lost production. Some of the root causes for attrition include the physically demanding work, rigid schedules, limited opportunities for growth, and a competitive labor market. Engagement is also a costly concern for aluminum companies, because ensuring high employee engagement ensures better results, including 32% fewer quality defects and 63% fewer safety incidents.
Adams presents two pathways for addressing these concerns — building up existing talent or hiring new talent. To build up their talent, companies can implement training and upskilling programs, create career paths, provide mentorship and development opportunities, and create a retention framework for top talent.
The impact of training can be measured with common metrics, including reduced mean-time to repair equipment, lower error rates, reduced skill qualification time, increase in multi-skilled labor, and overall improvement in operational efficiency. Generally, 40-50 hours of training per year is a good investment in employee development and 51-60 hours provides strong skill enhancement, but over 60 hours of training creates diminishing returns.
Creating career pathways with clear role progressions and defined skills, competencies, and training for each step helps employees see a path forward and supports a more satisfying employee experience. Meanwhile, mentorship (pairing newer employees with experienced mentors) helps build employee skills, confidence, and technical knowledge, while also reducing early career turnover (first 90–180 days).
A good retention framework should involve recognition and communication, career pathways, a safe and supportive work environment, flexible scheduling, and an inclusive culture. Recognition can come from employee of the month programs, peer-to-peer recognition, spot bonuses, team-based achievement, and other programs. Safety involves a combination of physical safety, supportive work practices (ergonomic tools and work design, reasonable workloads, and supervisor support), and psychological and emotional safety. Flexible scheduling can be achieved through shift swapping, compressed workweeks, flexible start and end times, part time or reduced hour shifts, job sharing, flexible overtime, and predictable sharing. Finally, an inclusive culture is one in which everyone feels respected, valued, and able to contribute, with consistent communication and expectations and fair recognition.
Building and supporting existing employees provides the most control for the company, as finding and hiring new employees comes with its own risks, costs, and challenges. Adams recommends streamlining the application process (such as interview scheduling and feedback), and highlighting the company’s growth and stability by presenting job security, predictable hours, and clear advancement paths. In addition, companies need to analyze and update their sourcing channels and maintain and nurture their hiring pool.
Lastly, Adams recommended a final strategy — as the worker shortage grows, then the most viable option may be automation to reduce head count. She noted that about 60% of all manufacturing operations could automate at least 30% of their tasks. While this shift from human to machine is expected to displace 85 million jobs, automation is also “expected to create 97 million new roles.”
Editor’s Note: This article first appeared in the June 2026 issue of Light Metal Age. To receive the current issue, please subscribe.