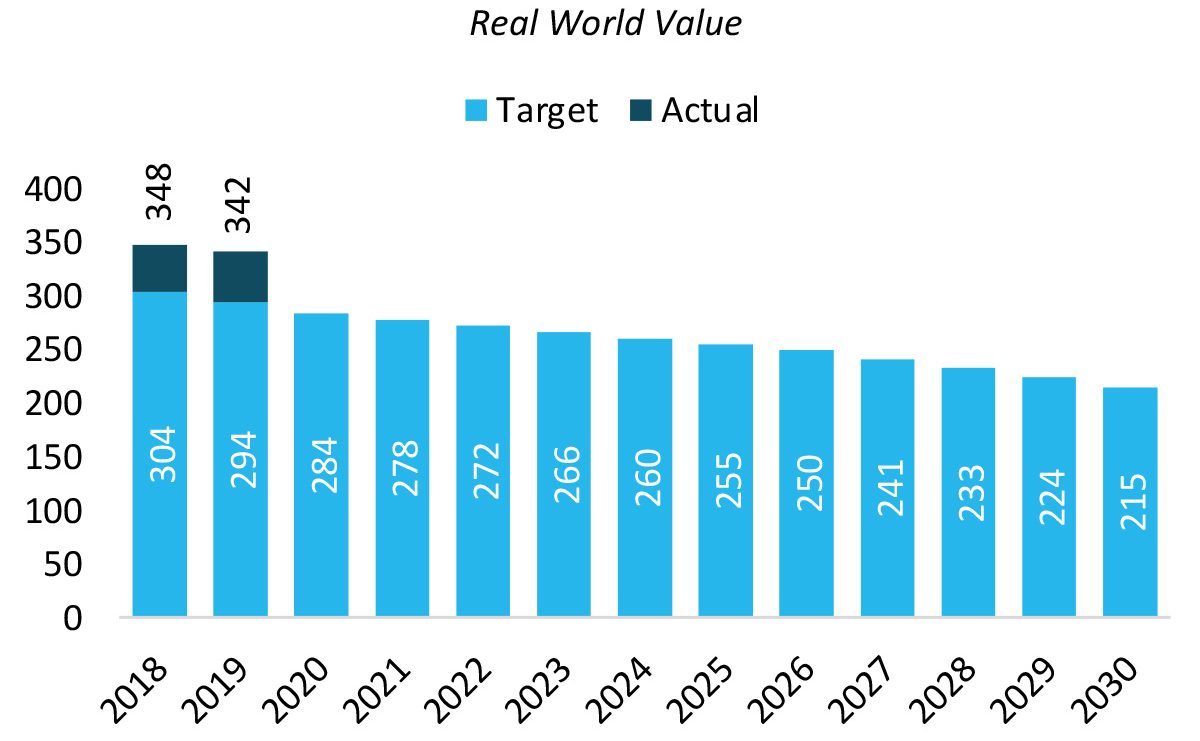
ShareFacebook, Twitter, Google Plus, Pinterest, Email Print Fig 2-DuckerFrontier Charts for LMA 1 by Andrea Svendsen October 20, 2020, 9:52 am 0 Comments ShareFacebook, Twitter, Google Plus, Pinterest, Email See more Previous entry Aluminum Continues Unprecedented Growth in Automotive Applications Back All Entries Leave a Reply Cancel replyYour email address will not be published. Required fields are marked *Comment Name * Email * Website Save my name, email, and website in this browser for the next time I comment.